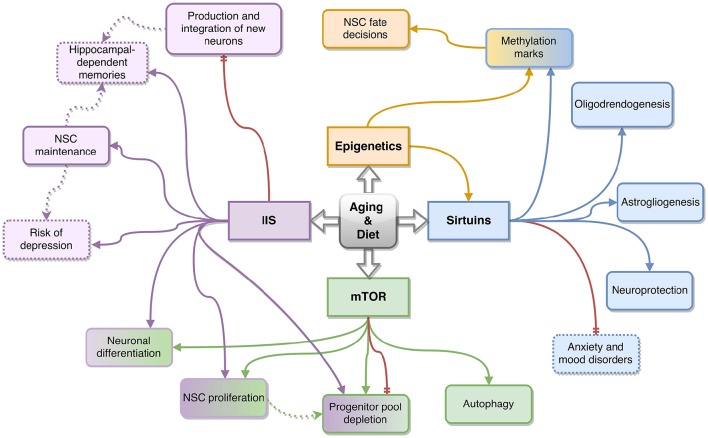
Figure 2.
Schematic summarizing the key effects of the Insulin/Insulin-like Growth factor (IIS) (in purple), mTOR (in green), sirtuin (in blue) and epigenetic (in orange) pathways on neural stem cell (NSC) function as a result of diet and aging. Solid arrows represent relationships between the molecular pathways (represented by the four rectangles in the center) and NSC function (represented by the outer, rounded rectangles) or related phenotypes (dotted rounded rectangles) discussed in this review. The dotted arrows connect possible molecular mechanisms behind the observed phenotypes reported in this review. Red arrows represent an effect caused by the inhibition of the pathway they stem from. Boxes with gradient coloring represent functions affected by multiple pathways.

