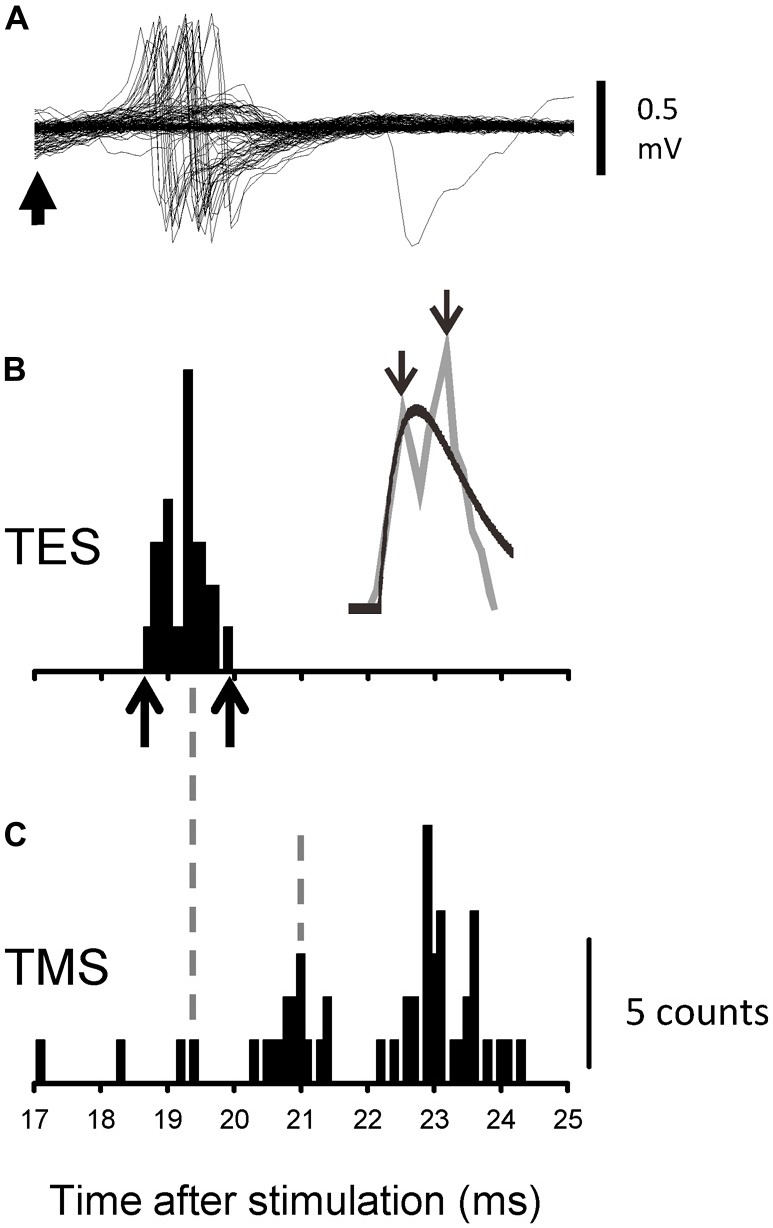
Figure 2.

Recordings from one representative motor unit (MU) following transcranial electrical stimulation (TES) and transcranial magnetic stimulation (TMS) during the co-contraction task. (A) Superimposed recordings of the activity of a single MU after TES. The upward arrow indicates 17 ms after TES. (B) Peristimulus time histograms (PSTHs) that were created from the recordings shown in (A). The identities of the spike activities were confirmed offline with a spike template-matching algorithm. The upward arrows along the abscissa indicate the onset and offset of the evoked activities. The gray line plots the moving average of the PSTH, together with the fitted curve (black line). The downward arrows indicate the peaks for which the latencies were measured. (C) The PSTH that was created with the recordings after TMS of the same MU as shown in (A,B). The timing of some peaks is indicated by vertical broken lines.
