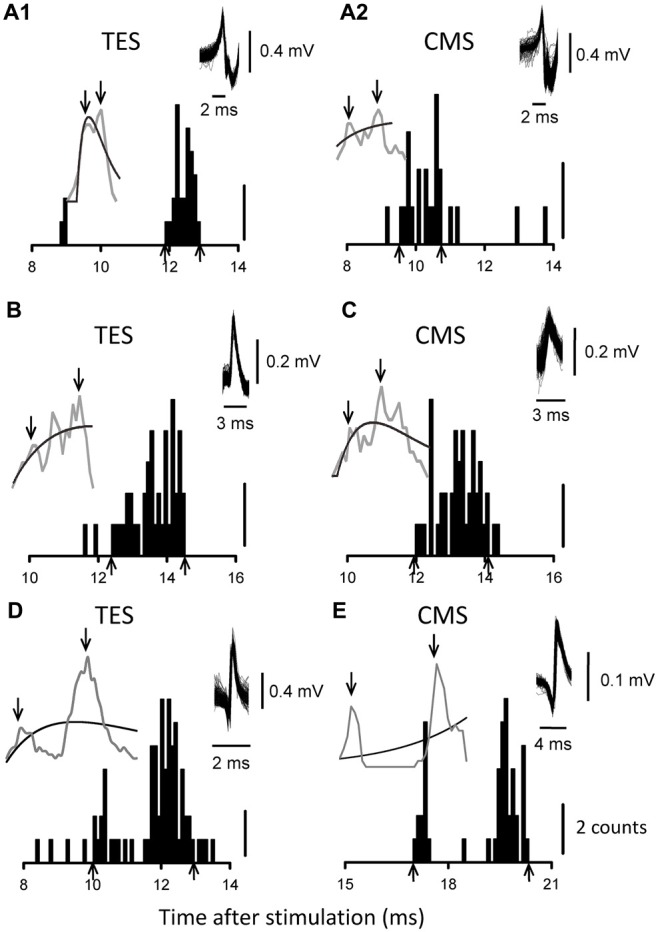
Figure 4.

PSTHs from five MUs. The results obtained with TES are shown in (A1,B,D), while those obtained with CMS are shown in (A2,C,E). (A1,A2) are from the same MU. The upward arrows indicate the onset or offset of the evoked activities, and the downward arrows indicate the measured peaks.
