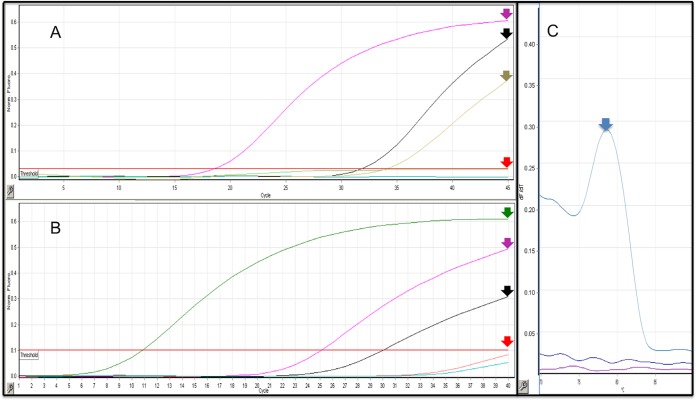
FIG 1.
(A) Linear amplification graph for the TaqMan-based assay. Leishmania (Viannia) braziliensis culture (pink arrow) (CT = 18.62), Leishmania (Viannia) guyanensis culture (black arrow) (CT = 31.86), Trypanosoma cruzi culture (brown arrow) (CT = 34.09). Leishmania amazonensis, DNA from healthy human skin, and a nontemplate control remained under the threshold line (red arrow) (CT = 0). y axis, normalized fluorescence; x axis, number of cycles. (B) Linear amplification graph for the SYBR Green-based assay. Leishmania (Viannia) braziliensis culture (green arrow) (CT = 10.84), Leishmania (Viannia) guyanensis culture (pink arrow) (CT = 25.13), and Trypanosoma cruzi culture (black arrow) (CT = 30.05). Leishmania amazonensis, DNA from healthy human skin and a nontemplate control remained under the threshold line (red arrow) (CT = 0). y axis, normalized fluorescence; x axis, number of cycles. (C) Melting curve for the SYBR Green-based assay. Expected melting curve analysis for Leishmania (Viannia) braziliensis culture (blue arrow). y axis, normalized fluorescence; x axis, temperature (°C). The images' scales were adjusted to fit the images in the panels.

