
FIG 2.
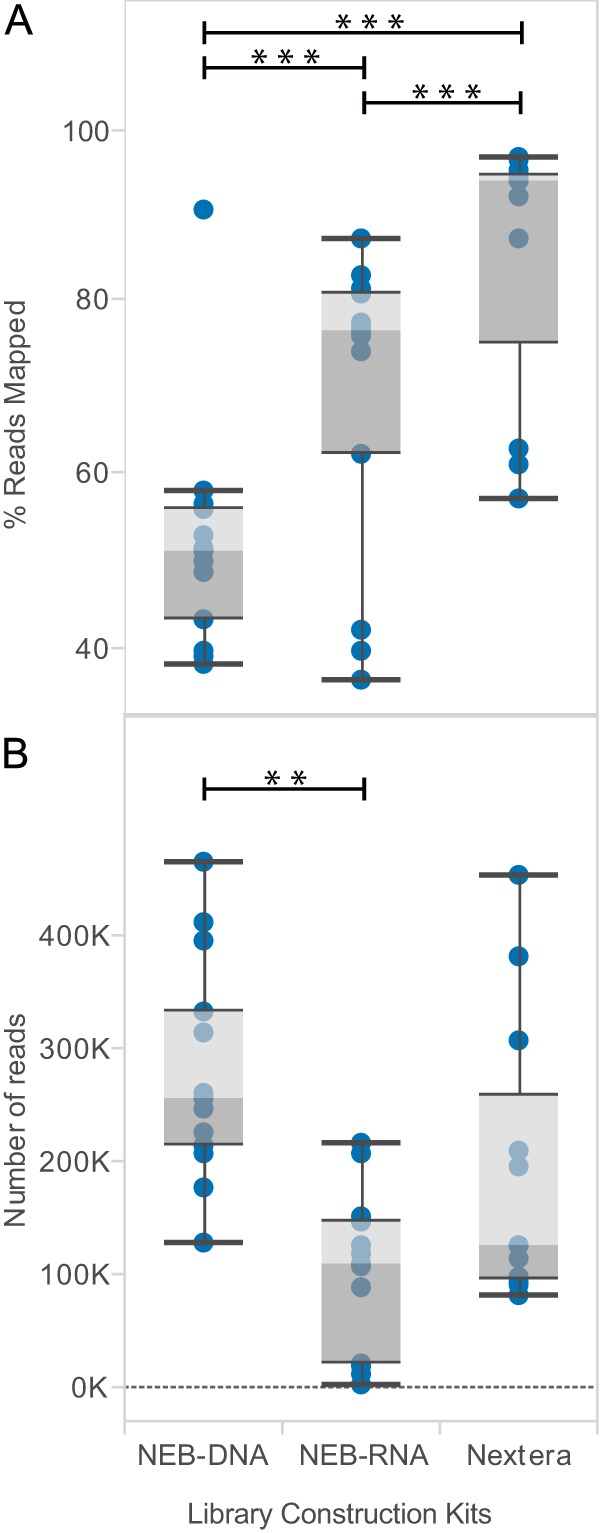
Comparison of three library preparation kits. (A) Percentages of reads mapping to poliovirus genome. (B) Total numbers of trimmed and filtered sequencing reads passing quality control (trimmed and deduplicated). Box-and-whisker plots are presented as described in Fig. 1. Nextera kit (n = 11), NEB kits (n = 13); **, P < 0.01; ***, P < 0.0001.