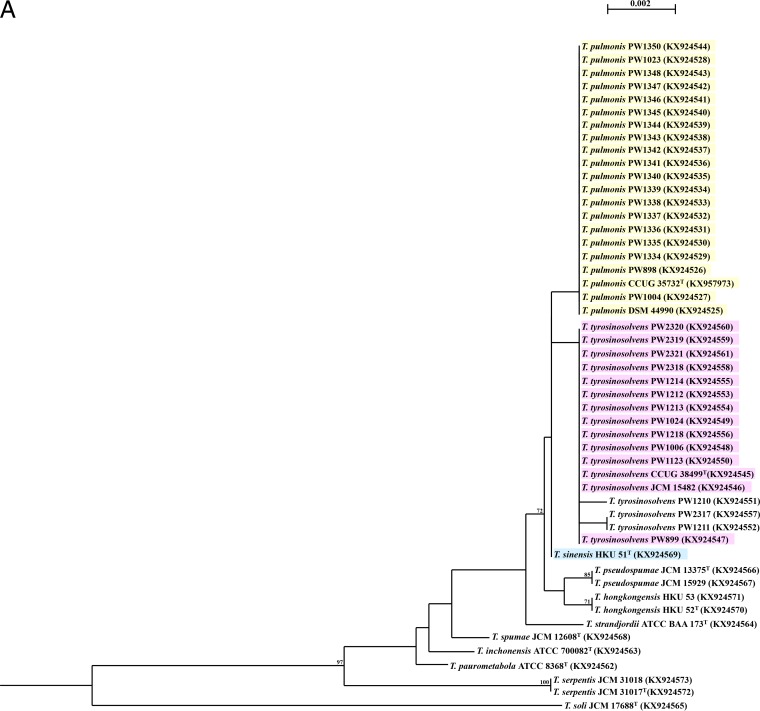
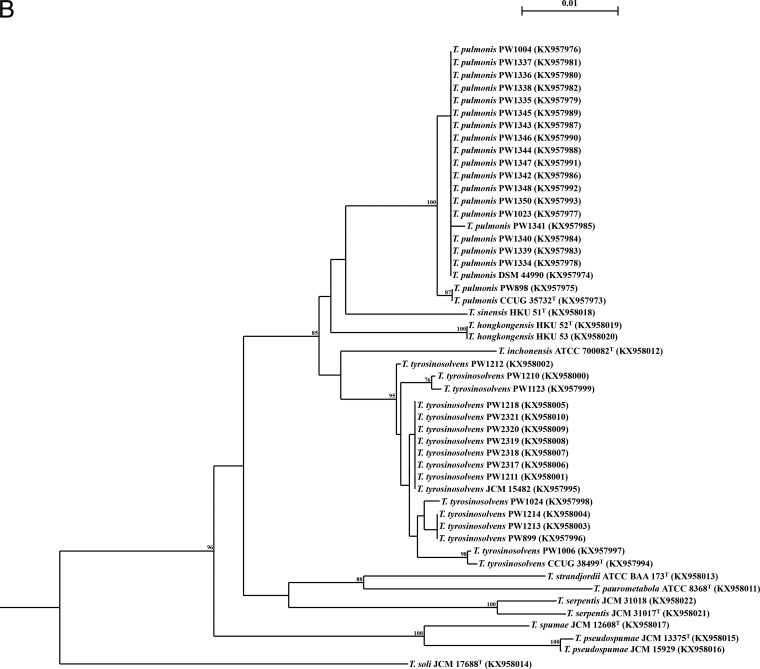
FIG 1.
Phylogenetic trees showing the relationship of the 50 Tsukamurella isolates (16 type and reference strains and 34 clinical isolates) inferred from partial 16S rRNA (1,221 nucleotide positions) (A) and groEL (677 nucleotide positions) (B) sequence data by the maximum likelihood method using the model GTR + I + G and Mycobacterium smegmatis MC2 155 (CP001663.1) as the outgroup. The scale bar indicates the estimated number of substitutions per base. Numbers at nodes indicate levels of bootstrap support calculated from 1,000 trees and expressed as percentages. Species shaded in the same color represent high sequence similarities (≥99.9%) between two different Tsukamurella species. All sequences obtained from this study and accession numbers are given as cited in the GenBank database.


