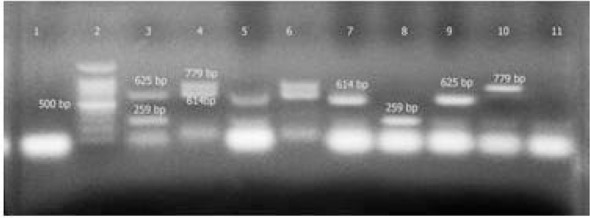
Fig. 1.

Results of direct mPCR; line1: negative control, line2: marker 100 bp, line3: positive control for rfb (259bp) and flic (625bp), line4: positive control for stx1 (614bp) and stx2 (779bp), lines 5 and 6:positive samples for all genes studied, lines 7, 8, 9, 10: four positive samples for every one of the genes studied, line 11: negative sample.
