
FIG 3.
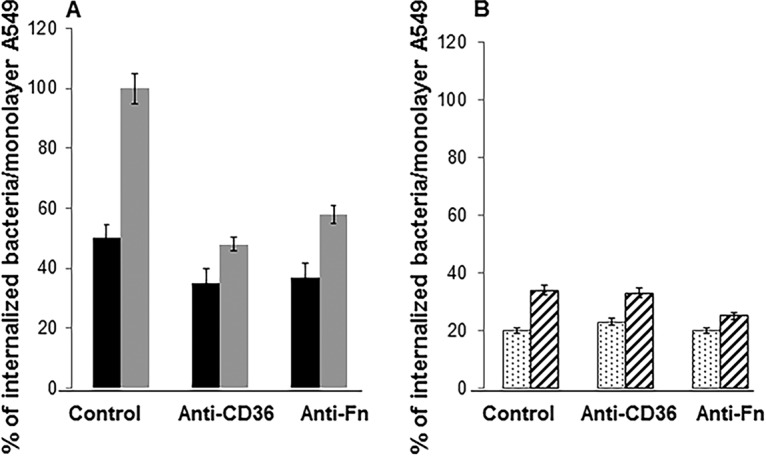
Quantification of the association of internalized S. aureus RN6390 (A) and QT7 (tet38) (B) and the A549 cell membrane using confocal microscopy. A549 cells were stained with the dye FM4-64. YFP-expressing bacteria (green) and host cells (red) were in contact for 2 h, followed by an additional 30 min in medium containing gentamicin and lysostaphin. We counted the numbers of green fluorescent bacteria (nonassociated bacteria) and yellow fluorescent bacteria (associated bacteria) from 60 A549 cells of 10 fields. The percentage of internalized bacteria was calculated based on the total number of green or yellow fluorescent bacteria counted from treated assays versus that of nontreated assays. The total number of RN6390 bacteria in nontreated assays was used as the reference point (100%). The assays were done in triplicate. The differences in the numbers of bacteria recovered in each assay with and without treatment with antibodies are statistically significant as determined by Student's t test (P < 0.05). Black bars in panel A represent nonassociated green cells, and gray bars represent yellow cells associated with A549 membrane. Dotted bars in panel B represent nonassociated green cells, and striped bars represent yellow cells associated with A549 membrane.