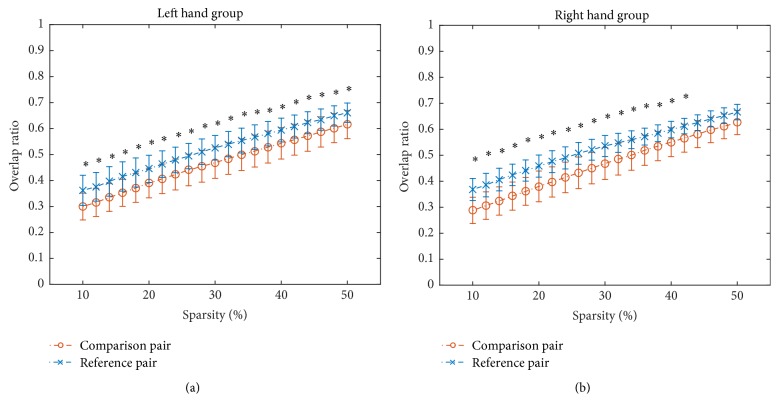
Figure 4.
The overlap ratios of adjacency matrices for comparison pair as well as those for reference pair under sparsity from 0.1 to 0.5 with an increment of 0.02 in LHG (a) and RHG (b) for continuous segment 4. Error bars denote the standard deviation across subjects. Asterisk (∗) denotes that the overlap ratio for reference pair is significantly greater (FDR corrected, p < 0.05) than that for comparison pair under the sparsity.

