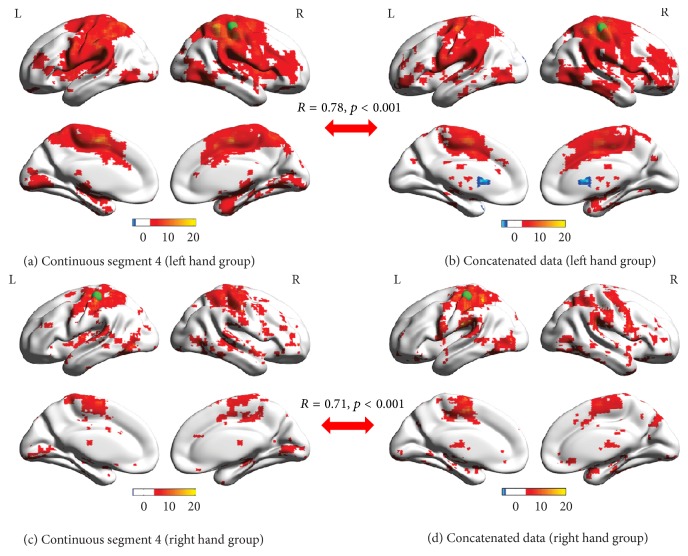
Figure 6.
Group-level seed-based FC maps of continuous segment 4 ((a) and (c)) and concatenated data ((b) and (d)) in LHG ((a) and (b)) and RHG ((c) and (d)). The index of color bar indicates t value of t-test. Voxels with hot color have positive FC with corresponding seed region (x = ±38, y = −26, and z = 56), indicated by a green sphere, with cool color for negative FC. R values and p values ((a) versus (b) and (c) versus (d)) indicate that the similarities between the seed-based FC maps of continuous segment 4 and concatenated data are significant.

