Figure 3.
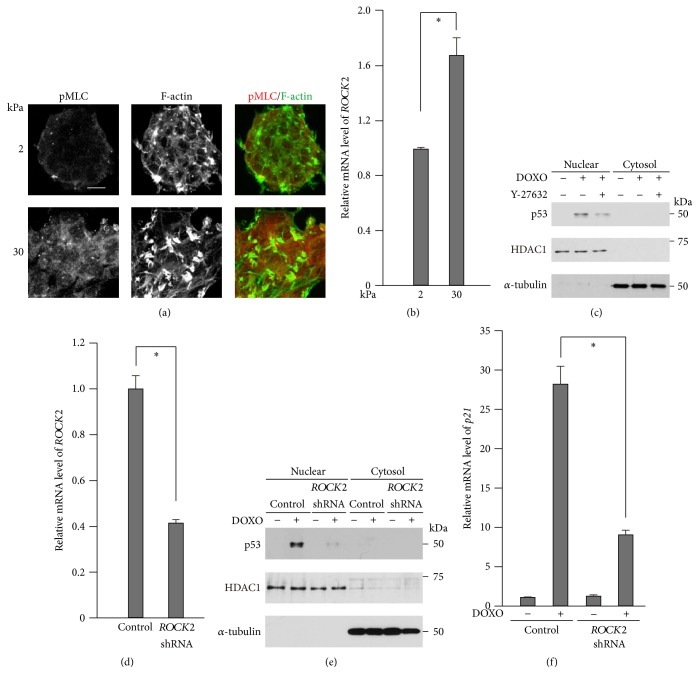
ROCK2 is involved in doxorubicin-induced p53 activation. (a) Cells were cultured on substrates with elasticities of 2 and 30 kPa. Confocal images of cells stained for phosphorylated MLC (pMLC2; red) and F-actin (green). Scale bars, 20 μm. Z-stack images with an interval of 1.0 μm were obtained using a confocal microscope, and projected images are shown. (b) ROCK2 expression in cells cultured on substrates with elasticities of 2 and 30 kPa was evaluated by quantitative real-time PCR. Each bar represents the mean ± SD; n = 3. Asterisks, p < 0.02. (c) Nuclear extracts and cytosol extracts from cells cultured in the presence or absence of DOXO (1 μg/mL) and/or Y-27632 (10 μM) for 16 h were subjected to immunoblot analysis with antibodies against p53, HDAC1 as a nuclear marker, and α-tubulin as a cytosol marker. (d–f) The cells were infected with a control or ROCK2 shRNA-expressing retrovirus. (d) ROCK2 expression was evaluated as in (b). (e) Nuclear extracts and cytosol extracts from cells cultured in the presence or absence of DOXO for 16 h were subjected to immunoblot analysis with antibodies against with p53, HDAC1 as a nuclear marker, and α-tubulin as a loading control or cytosol marker. (f) p21Waf1 expression in cells cultured in the presence or absence of DOXO for 24 h was evaluated by quantitative real-time PCR. Each bar represents the mean ± SD; n = 3. Asterisks, p < 0.01.

