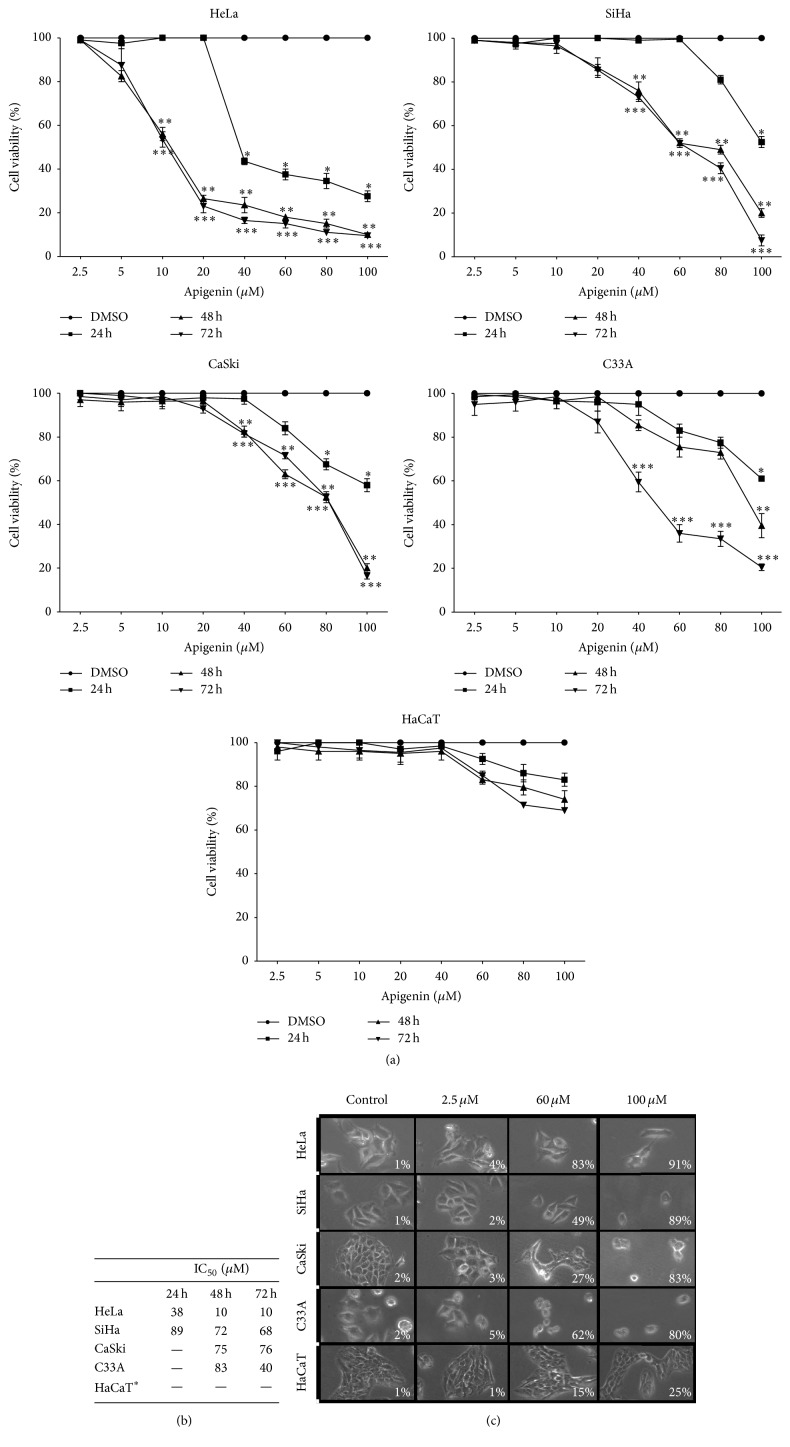
Figure 2.
Cytotoxic effects of apigenin on cervical cancer cell lines (HeLa, SiHa, CaSki, and C33A cells) and a human keratinocyte cell line (HaCaT cells). (a) Dose-response curves indicating the viability of the cervical cancer cell lines and the HaCaT cells (control cells) following exposure to apigenin (2.5–100 μM) for 24, 48, and 72 h. A statistically significant difference in cell viability was observed between the HeLa, SiHa, CaSki, and C33A cells and the HaCaT cells. (∗), (∗∗), and (∗∗∗) represent statistically significant (P < 0.05) differences (24, 48, and 72 h, resp.) between the cancer cell lines and the control cells. (b) Approximate IC50 values determined according to the cell viability obtained in (a). ∗For the HaCaT cells, the IC50 value was > 100 µM. Each line represents the mean ± SD of three separate experiments conducted in triplicate. (c) Differential effects on cell morphology induced by apigenin after 72 h of exposure. Cell photomicrographs were taken (20x magnification), and the percentage of cell death was determined by Trypan blue staining. Note that the HaCaT cells do not show morphological changes.

