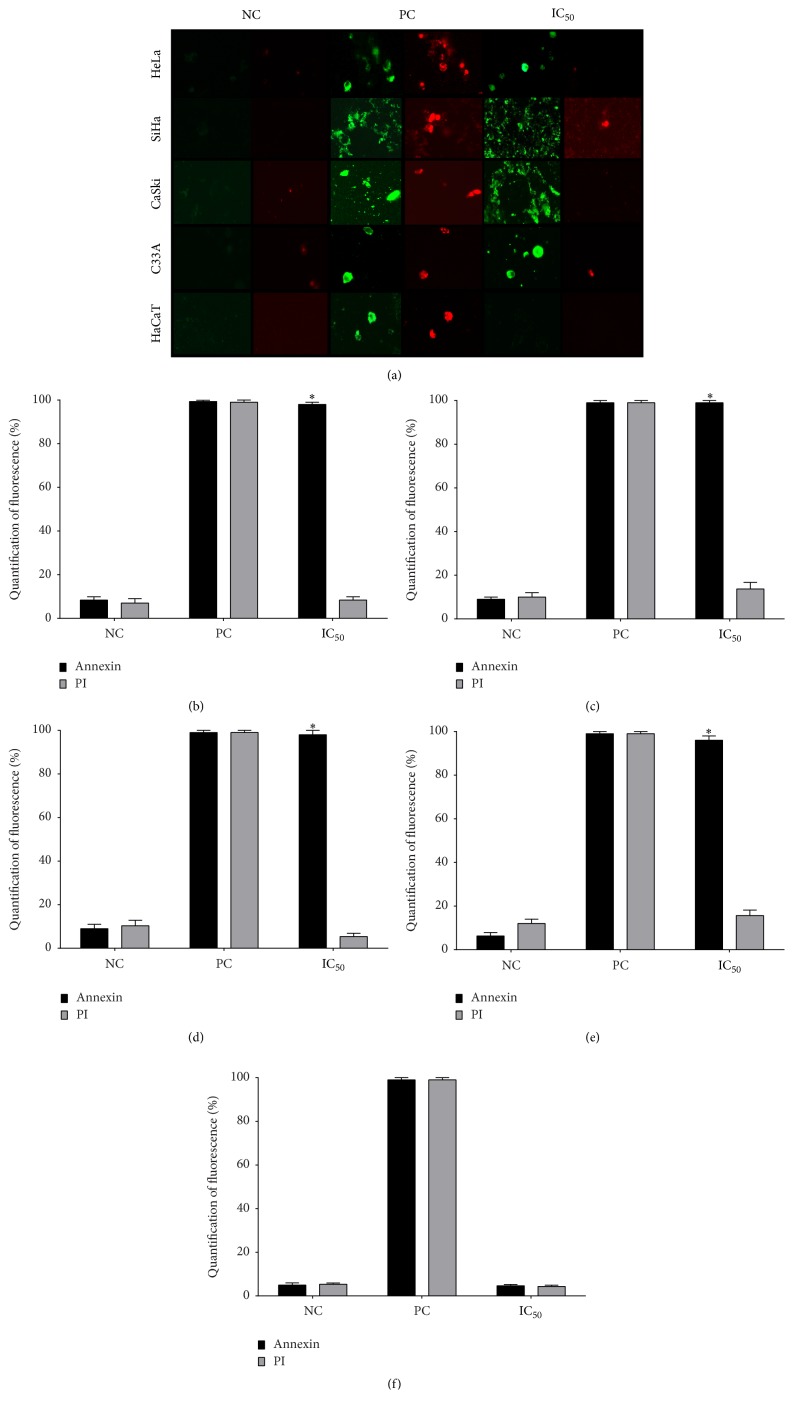
Figure 4.
Assessment of death pathway associated with apigenin in cervical cancer cell lines and HaCaT cells. (a) Representative figures of cancer cell lines (HeLa, SiHa, CaSki, and C33A) and HaCaT cells exposed to apigenin (IC50 of each cell line) at 48 h stained with the apoptosis marker Annexin V (green fluorescence) and the necrosis marker propidium iodide (PI) (red fluorescence). (b, c, d, e, and f) Histograms show the mean % Annexin V-positive cells (HeLa, SiHa, CaSki, C33A, and HaCaT cells, resp.) treated with apigenin (IC50 of each cancer cell line) for 48 h. Camptothecin (20 μM) and digitonin (80 μM) were used as positive controls for apoptosis and necrosis, respectively (PC), and cells not treated with apigenin were used as negative controls (NC). Data are shown as the mean ± SD of three independent experiments conducted in triplicate. ∗P < 0.05 versus the negative control. Magnification: 20x.

