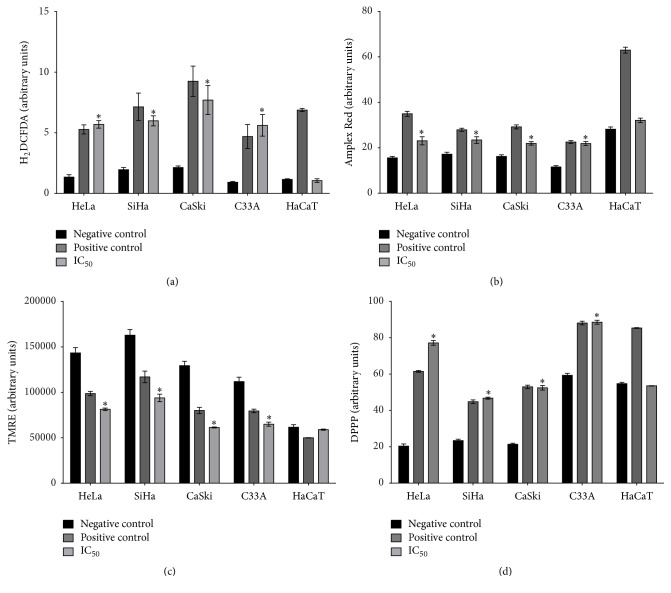
Figure 6.
Effects of apigenin on cellular oxidative stress. (a) Total ROS production was evaluated during exposure of cervical cancer cell lines (HeLa, SiHa, CaSki, and C33A) and HaCaT cells to apigenin using the fluorescence probe H2DCFDA. The positive control was treated with 10 μM H2DCFDA in the dark. (b) Detection of extracellular H2O2 levels in all cell lines exposed to apigenin was conducted using an Amplex® Red assay kit. H2O2 was used as a positive control. (c) Mitochondrial membrane potential (Δψm) after exposure to apigenin measured using a TMRE fluorescence probe. Carbonyl cyanide m-chlorophenylhydrazone (CCCP) was used as a positive control. (d) Lipid peroxidation (LP) after exposure to apigenin using the fluorescence probe diphenyl-1-pyrenylphosphine (DPPP). Hydrogen peroxide was used as a positive control. Arbitrary units (relative fluorescence units, RFU) were based directly on fluorescence intensity. Data are expressed as the mean ± SD of three independent experiments conducted in triplicate. ∗P < 0.05 versus negative control.

