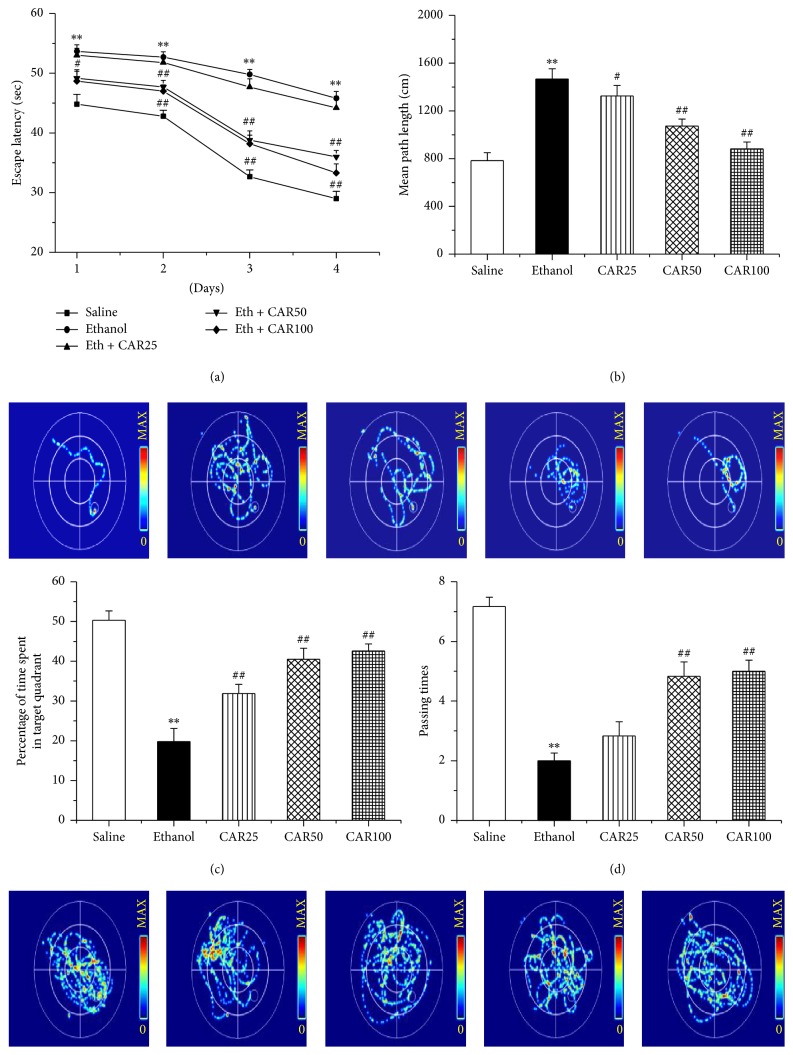
Figure 3.
Carvacrol ameliorated ethanol-induced cognitive impairment in C57BL/6 mice. Escape latency (a), mean path length (b), mice that stayed in the target quadrant (c), and passing times (d) are shown in the saline, ethanol, and different carvacrol dose groups. CAR25, CAR50, and CAR100 indicate carvacrol 25, 50, and 100 mg/kg-treated groups. The data are expressed as the mean ± SEM (n = 10 per group). ∗∗P < 0.01 compared to saline group; #P < 0.05 and ##P < 0.01 compared to ethanol group.

