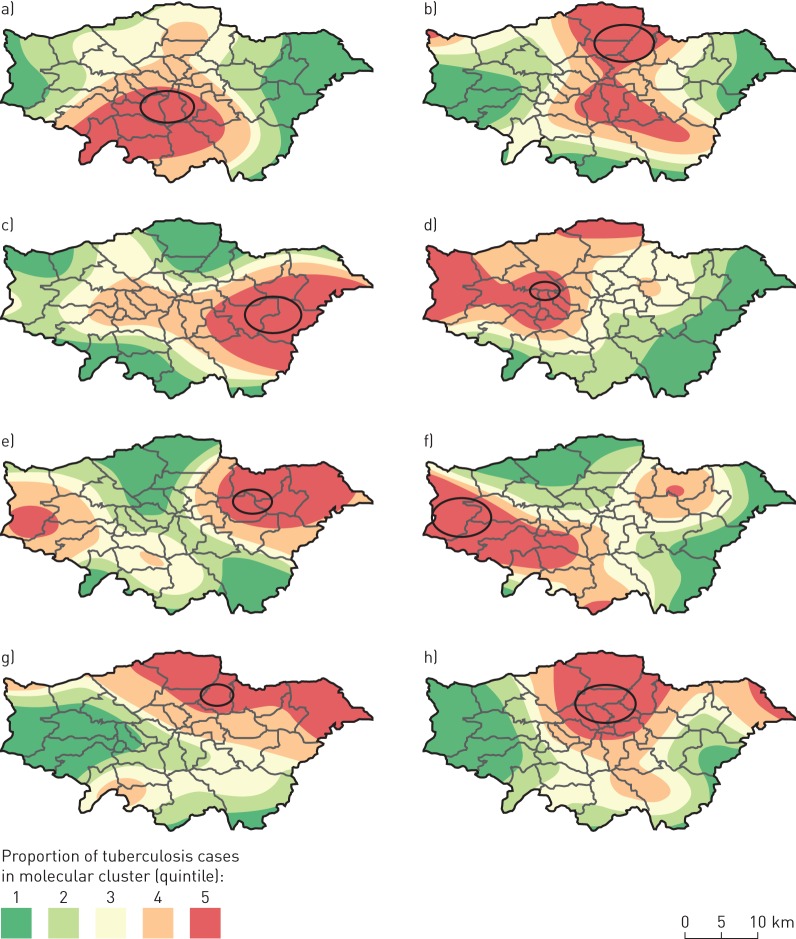
FIGURE 4.
a–h) Locations of significant spatial clusters of cases within eight molecular clusters of tuberculosis (TB) in London (2010–2014), overlaid on smoothed incidence maps. Ovals represent areas of significant spatial clustering (p<0.05) with more than 10 cases of the given molecular cluster compared with the general distribution of TB cases. The proportions of cases in molecular clusters compared with all other TB cases are represented through kernel density estimation (bandwidth 5 km).

