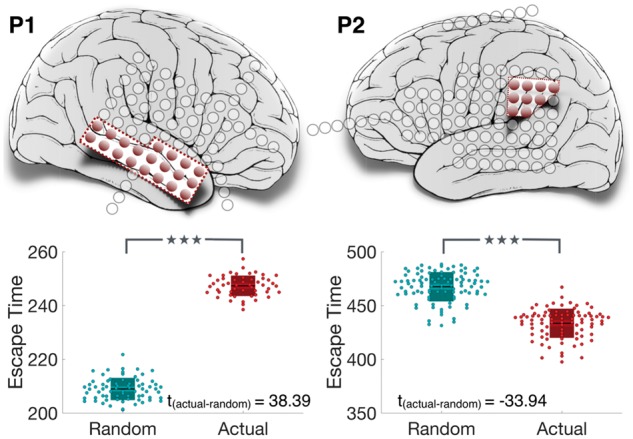
Figure 5.

Node removal to predict surgical outcome. Resected cortical tissues are coloured in red. Nodes within the resected tissue are removed from the model. The resulting increase in escape time is shown in the box plot (in red), which is compared against the increase in escape time due to removal of the same number of randomly selected nodes, averaged over 100 instances (in blue). *P = 0.005–0.05; **P = 0.0005–0.005; ***P < 0.0005 computed using the non-parametric Wilcoxon rank sum test.
