Figure 3.
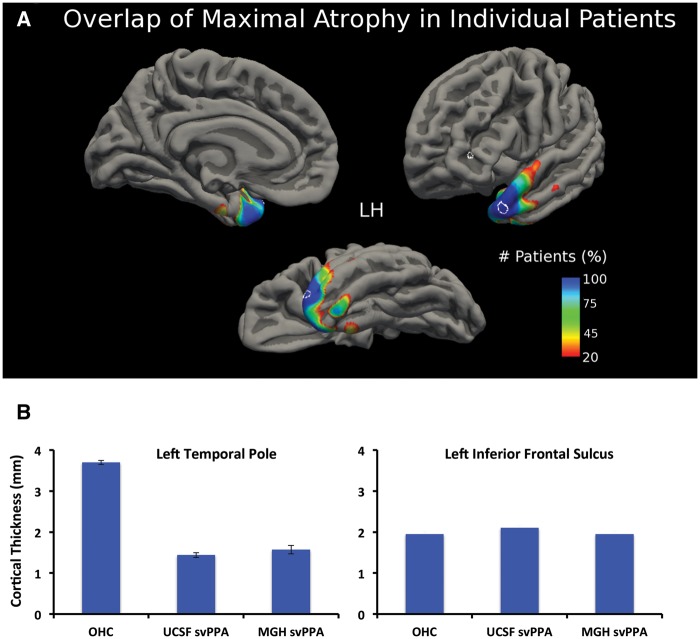
Cortical atrophy in each individual svPPA patients overlaps with the same area of the left temporal pole identified in the group analysis. (A) A heat map based on individual patients atrophy maps revealed that 100% of patients had their maximal atrophy point (top 1% of cortical atrophy) in the same region of the left temporal pole, just lateral to the tip (circled; MNI coordinates: x = −42, y = 17, z = −31) and a small area at the medial region (MNI coordinates: x = −27, y = 7, z = −36). (B) Relative to controls, cortical thickness was substantially lower in patients in this focal atrophic point of the left temporal pole (thickness of this region in patients is less than half of that of controls). In contrast, a control region placed in the left inferior frontal sulcus did not differ in thickness between patients and controls (also circled in A). OHC = older healthy control group.

