
Figure 8.
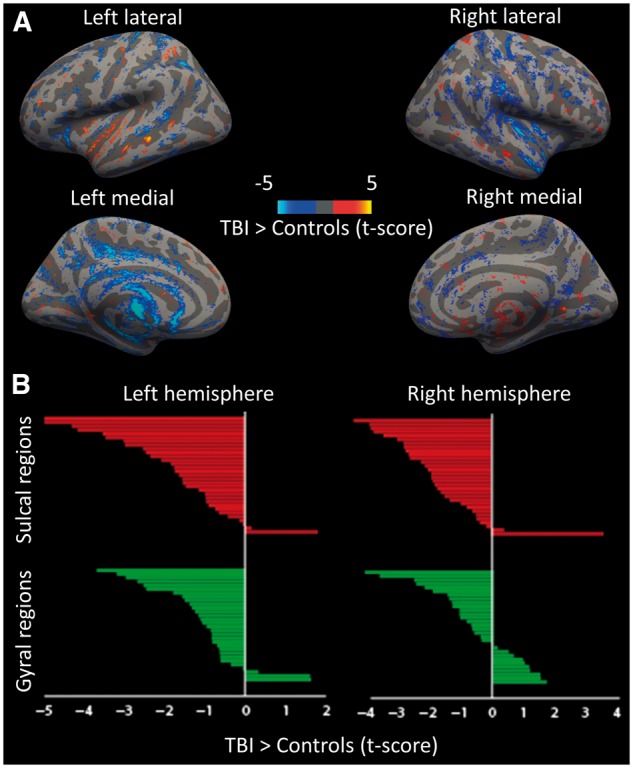
Empirical neuroimaging results from 97 patients with TBI and 51 healthy control subjects. (A) Whole brain multiple regression of fractional anisotropy at the white matter–grey matter boundary. Contrast of TBI > Control, threshold at t > 1.6. (B) The region of interest analysis; the green bars indicate gyral regions and the red bars indicate sulcal regions.