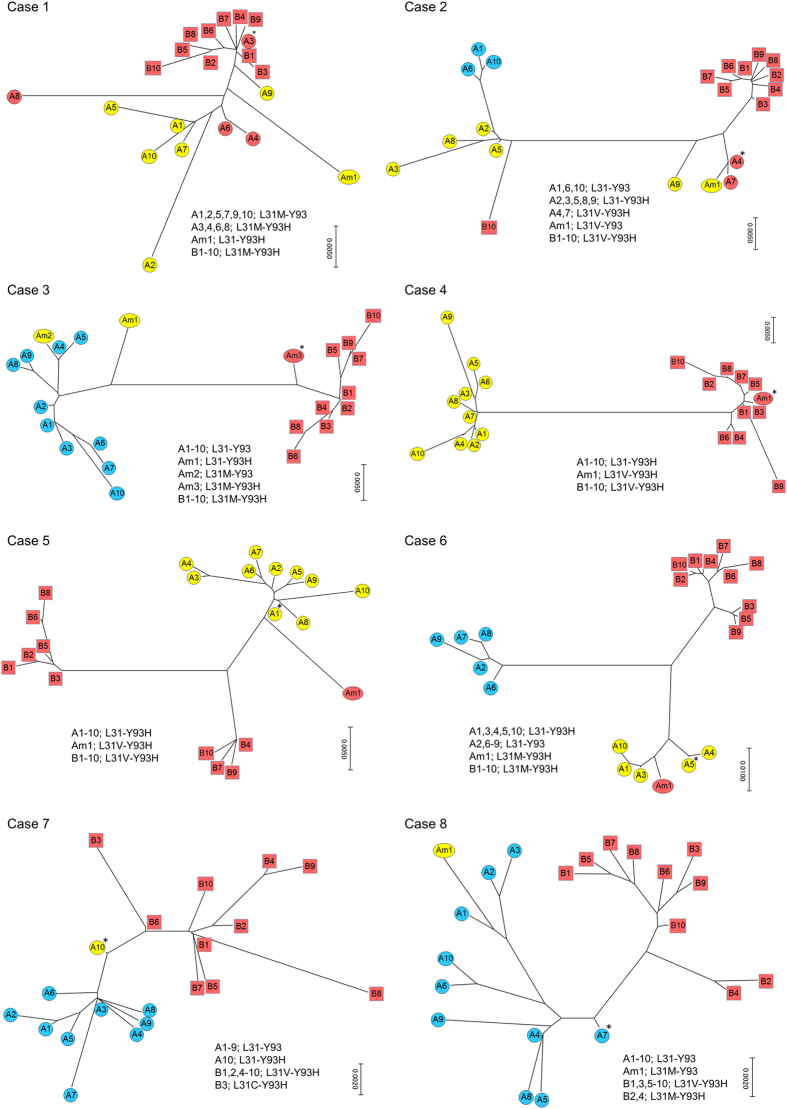
Figure 1. Phylogenetic tree analysis of the non-SVR patients with ASV/DCV.
In each case, the top 10 clusters from the HCV clones at baseline are represented as A1 to A10 with coloured circles, and the top 10 clusters at VF are represented as B1 to B10 with coloured squares. Blue, yellow and red colours represent the L31-Y93 wild type, L31M/V or Y93H single substitution and L31M/V-Y93H double substitution, respectively. The top minor substituted cluster at baseline was also represented with an Am in the phylogenetic tree (for example, Am1). *Represents the putative original cluster before treatment that contributed to the L31M/V-Y93H double substitution after treatment.

