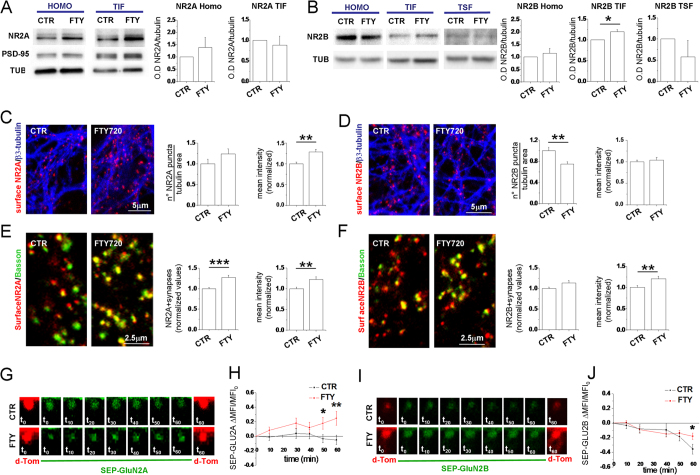
Figure 4. FTY720 modulates GLUN2B localization in the postsynaptic fraction and increases surface GLUN2B and GLUN2A expression at synapses.
(A,B) Western blotting of the homogenate (HOMO), postsynaptic triton insoluble fraction (TIF) and triton soluble fraction (TSF) obtained from control and FTY720-treated hippocampal neurons (DIV14). Tubulin is used as loading control, while PSD-95 as a marker of postsynaptic fraction. FTY720 leads to an increased GLUN2B localization in the TIF leaving the total amount of GLUN2B unaltered while doesn’t alter GLUN2A localization in TIF (Student’s t-test, P = 0.0275 N = 4). (C) Confocal images of neurons live stained for GLUN2A, fixed and counterstained against β3-tubulin. Relative quantification of density of GLUN2A puncta are shown on the left (Mann-Whitney Rank Sum Test, P = 0.070) and mean intensity of GLUN2A clusters on the right (Mann-Whitney Rank Sum Test, P = 0.001). (D) Images of neurons live stained for GLUN2B and quantification of GLUN2B puncta density (Mann-Whitney Rank Sum Test, P = 0.003) and mean intensity (Student’s t-test, P = 0.610). (E,F) Images of neurons live stained for GLUN2A (E) or GLUN2B (F), fixed and counterstained against the presynaptic marker bassoon. Right histograms show quantification of GLUN2A positive synapses (Mann-Whitney Rank Sum Test, P ≤ 0.001) and GLUN2A puncta mean intensity (Mann-Whitney Rank Sum Test, P = 0.005) (number of analyzed puncta: control = 1010, FTY720 = 720; number of analyzed fields: control = 35; FTY720 = 30) or GLUN2B positive synapses (Mann-Whitney Rank Sum Test, P = 0.005) and GLUN2B puncta mean intensity (number of analyzed puncta: control = 1250, FTY720 = 807; number of analyzed fields: control = 37; FTY720 = 32). (G) Representative images of spines co-transfected with SEP-GluN2A(green) and dTom (red) acquired at the indicated time point in control and FTY720-treated neurons. (H) XY graph representing the DMFI/MFI0 of SEP-GluN2A over time (number of analysed spines: control = 40, FTY720 = 47; Mann-Whitney Rank Sum Test, P = 0.037 at t50 and P = 0.009 at t60). (I) Images of spines co-transfected with SEP-GluN2B and dTom as in G. (J) XY graph representing the DMFI/MFI0 of SEP-GluN2B over time (number of analysed spines: control = 15, FTY720 = 22; Mann-Whitney Rank Sum Test, P = 0.030 at t60).

