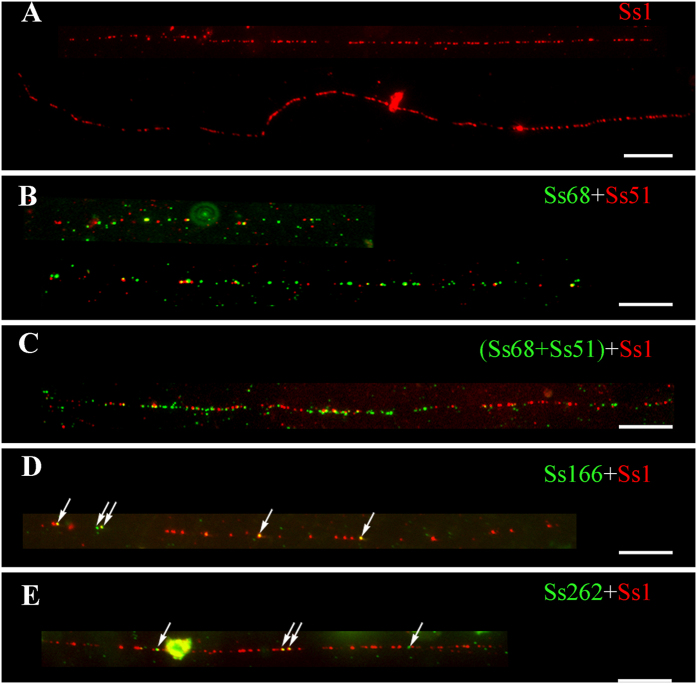
Figure 6. Fiber-FISH mapping of the centromeric repeats in S. spontaneum clone SES 208.
(A) Two complete fiber-FISH signals derived from the satellite repeat Ss1 probe. (B) Two partial fiber-FISH signals derived from Ss68 (green) and Ss51 (red) probes. (C) One complete fiber-FISH signal derived from Ss68 + Ss51 (green) and Ss1 (red) probes. (D) One complete fiber-FISH signal derived from Ss166 (green) and Ss1 (red) probes. The signal spots of Ss166 probe are indicated by arrows. (E) One complete fiber-FISH signal derived from Ss 262 (green) and Ss1 (red) probes. The signal spots of Ss262 probe are indicated by arrows. Bar = 10 μm.

