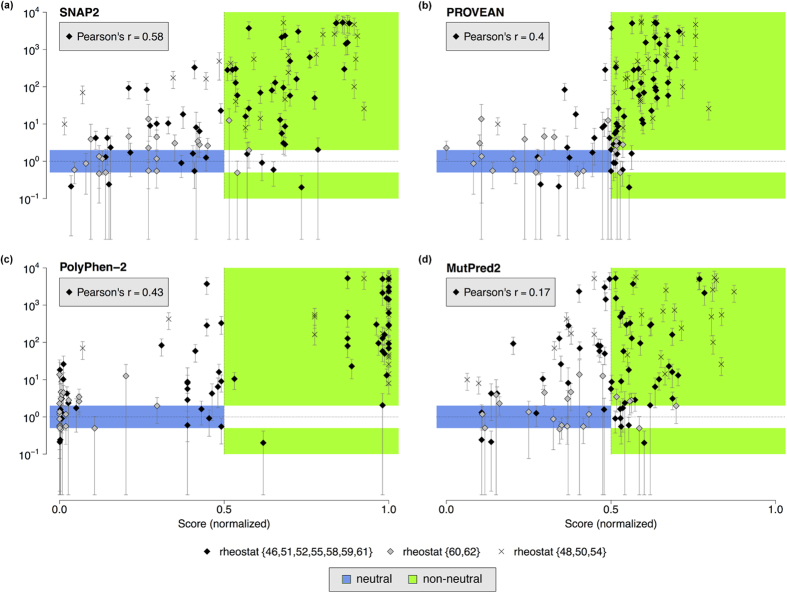
Figure 5. Correlation between experimentally measured fold-changes and predicted variant-effect scores.
Panels (a) SNAP2; (b) PROVEAN; (c) MutPred2; (d) PolyPhen-2 show the relationship of the computationally and experimentally derived scores. For each variant at all rheostat positions, fold-change in repression relative to wild-type LacI is shown on log scale (Y axis), whereas predicted scores are normalized to the linear range [0, 1] (X axis). The blue area depicts the scores expected for neutral variants (fold-change between 0.5 and 2.0); the green area depicts scores expected for non-neutral variants. The Pearson product-moment correlation coefficient (Pearson’s r) is given for the rheostat_9 set. Results from other predictors are in Supplementary Fig. 4.

