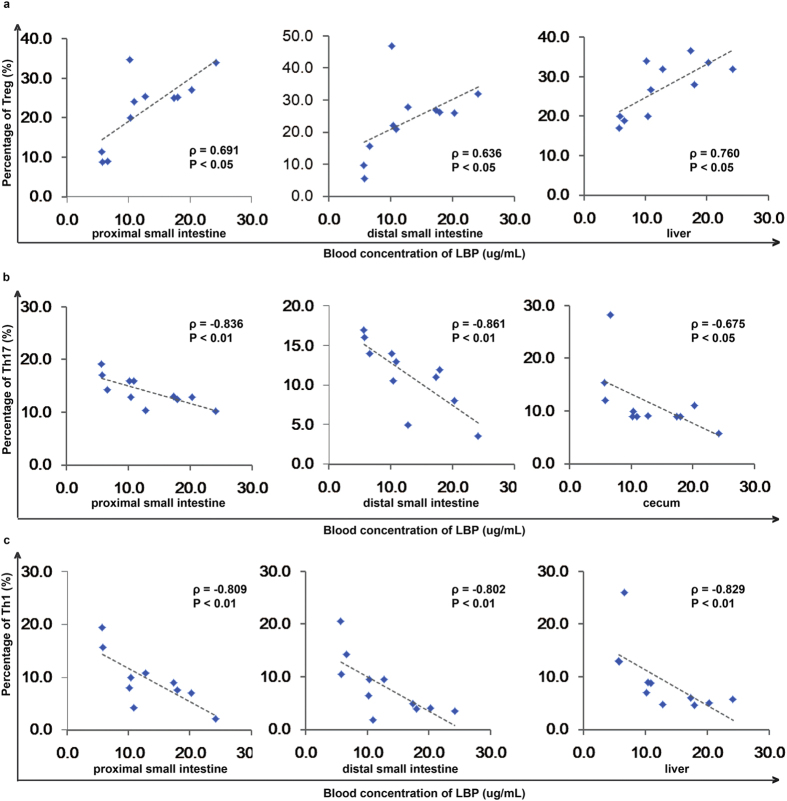
Figure 5. BT is associated with changes in the cellular immunity response.
(a) Correlations between the concentration of LBP and the percentage of Treg cells in the proximal small intestine, distal small intestine, and liver. (b) The correlation between the concentration of LBP and the percentage of Th17 cells in the proximal small intestine, distal small intestine, and caecum. (c) The correlation between the concentration of LBP and the percentage of Th1 cells in the proximal small intestine, distal small intestine, and liver. Spearman’s rank test was used.

