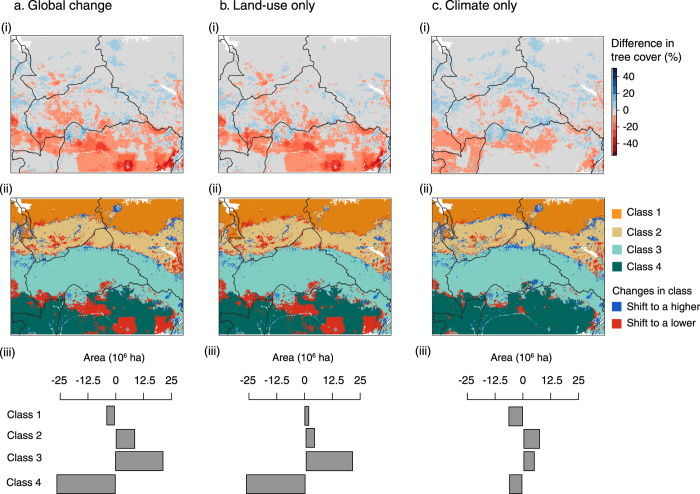
Figure 5. Changes in tree cover and classes’ spatial distribution for RCP 2.6.
The first panel represents differences in tree cover between simulated future and current tree cover values (i), the second panel represents the spatial distribution of the four vegetation classes and their shifts for 2070 (ii), and the third panel represents the changes in area occupied by the four vegetation classes in 2070 (iii) for global change (a), land-use change only (b) and climate change only (c) scenarios. The maps were generated using R version 3.1.385.

