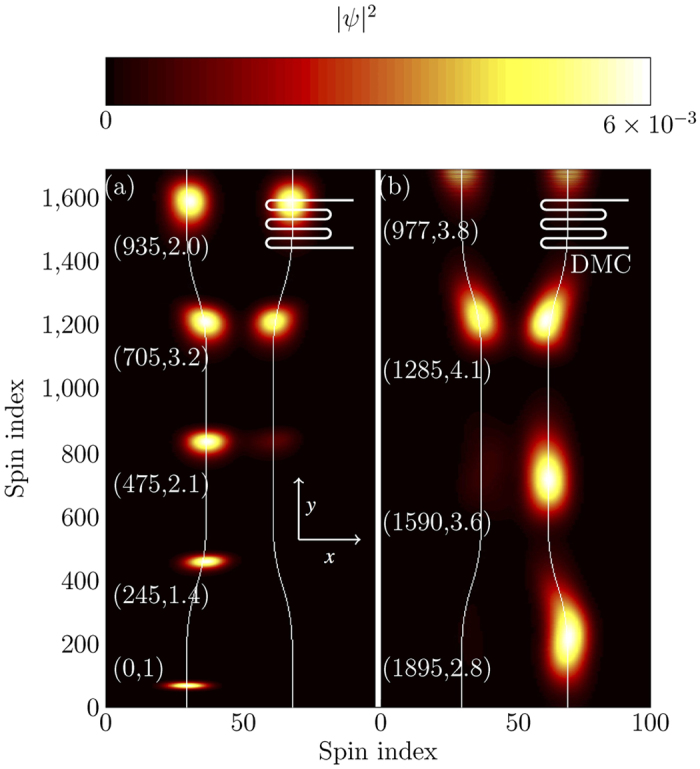
Figure 7. Instances of full time evolution of a Michelson interferometer (for the device schematics seeFig. 1(b)).

White lines represent the centre of each guide. Snap shots of the population are overlaid on top of each other, where the colour represents the |ψ|2. Each snapshot is scaled such that its peak value appears as bright as the first instance. The right arm has a DMC at its end, which is used as a tuneable source of phase difference between both arms (see Fig. 8 for detail). Numbers placed next to each snap shot are the time stamps (in units of 1/J) and scaling factor respectively. (a) The magnon was initialised in state |L〉 and it splits into  upon passing through the splitter. In this particular case there is no relative phase shift upon reflection. (b) After reflection and second pass through the splitter the magnon is transmitted to |R〉.
