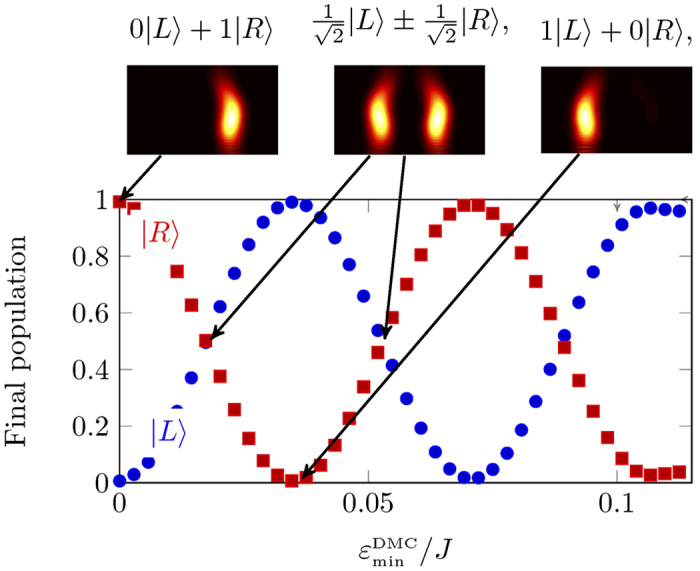
Figure 9. Population in each arm at the end of the protocol, as a function of the depth of the potential due to the magnonic crystal, which in turn is a function of current in the crystal.

The population in right and left arm is shown in red and blue. We initialise the magnon in state |L〉. With no phase shift the final state is |R〉. As the potential depth increases, the population varies sinusoidally between zero and one in both arms. The population goes through the whole state space and comes back to |L〉 at  .
.
