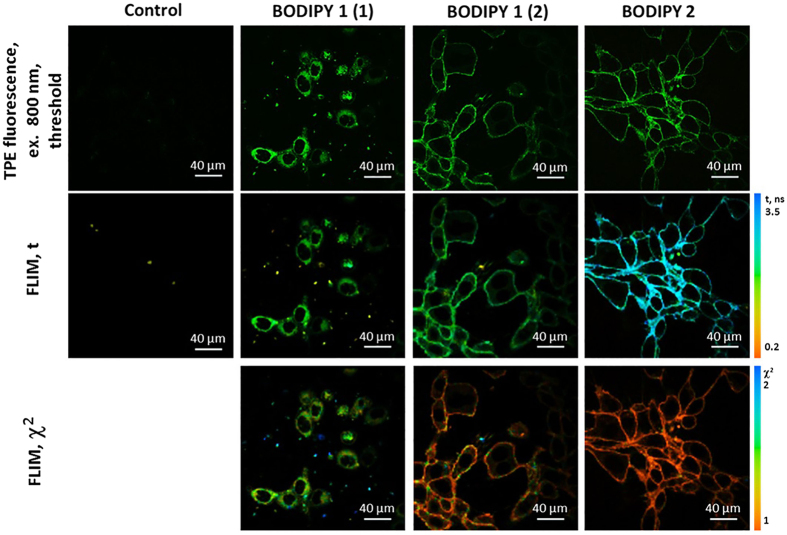
Figure 2. Two-photon excited (TPE) fluorescence and FLIM images of CT26 cells incubated with 4.5 μM solutions of BODIPY1 and BODIPY2.
BODIPY1 was dissolved in high and low concentration of polymeric brushes (2 and 12.4 mg/ml, corresponding to labels (1) and (2), respectively). BODIPY2 was dissolved in PBS. Excitation was 800 nm, detection −409–680 nm. Control CT26 cells imaged at identical conditions that were not incubated with any fluorescence dyes are also shown in the first column. The χ2 maps confirm good monoexponential fitting in the areas where χ2 ≈ 1 (indicated by the orange colour).

