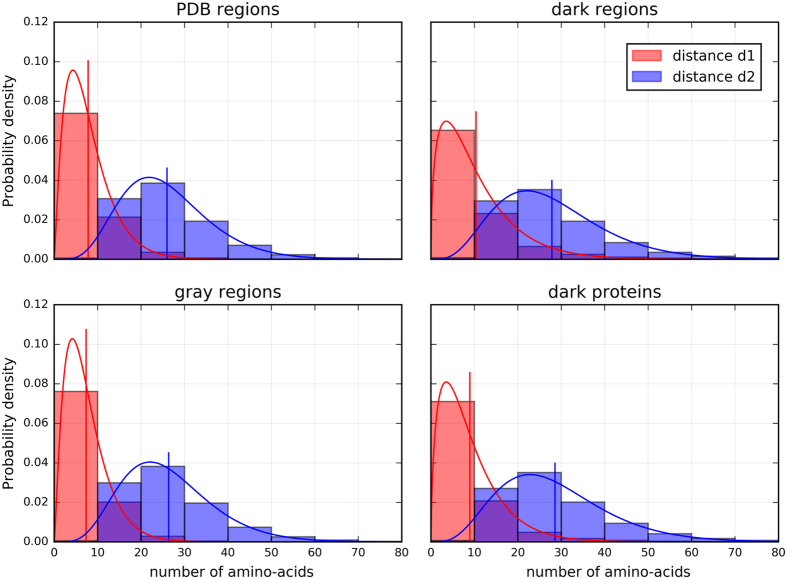
Figure 2. Distances between hydrophobic clusters (HCA domains of the protein universe).
The distance d1 corresponds to the number of amino acids between two hydrophobic clusters, the distance d2 corresponds to the distance d1 plus the number of amino acids within the two hydrophobic clusters (see Fig. S12). Distributions were fitted using a gamma distribution (solid lines), the vertical lines corresponding to the expected values of the fitted distributions.

