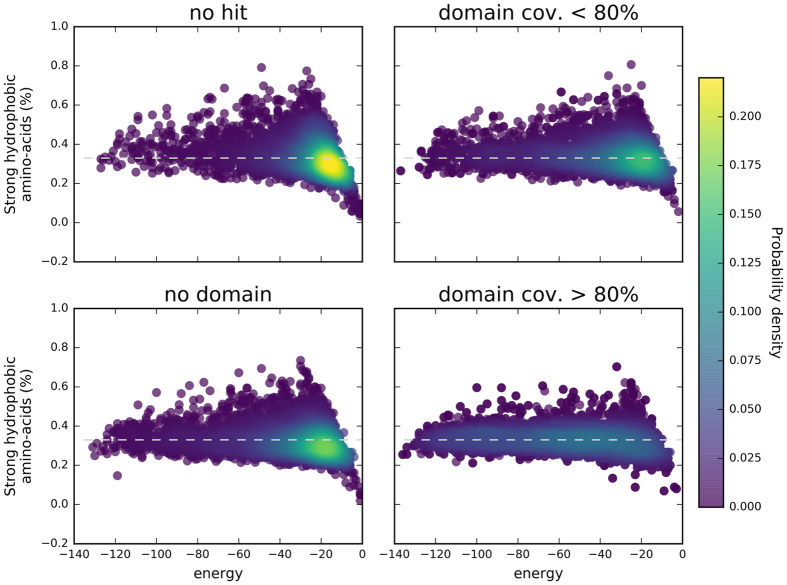
Figure 6. Frequency in strong amino acids (V, I, L, F, M, Y, W) and protein sequence energy (dark sequences after TREMOLO-HCA filtering).
Frequency and folding energy (HP-struct) were computed for the four final groups of HCA domains from the dark proteomes after Tremolo-HCA filtering. The colormap corresponds to the probability density computed from a Gaussian kernel estimation over the data points. The four groups of HCA domains have distributions similar to those obtained with the initial groups of sequences (dark proteins and regions, gray regions, PDB regions).

