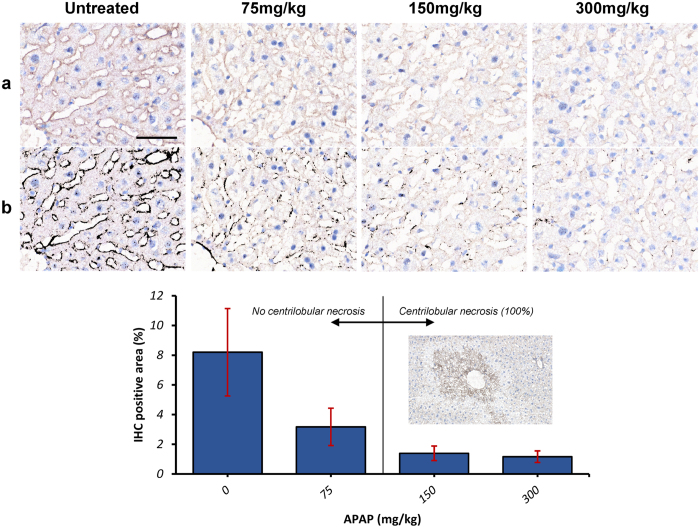
Figure 6. Hepatic Expression of ZO-1 following treatment of mice with increasing doses of APAP: Histopathology and immunohistochemical quantification.
ZO1 immunohistochemical staining highlights hepatocytes and is progressively lost with increasing APAP dose (0, untreated; 75–300 mg/kg APAP; n = 2 animals per treatment group). Raw pictures (pre-processed) are displayed in (a), and the results of the DAB detection algorithm in (b). Note the membranous, continuous ZO-1 staining highlighting hepatic cords/sinusoidal areas in a control liver, and the progressive loss of ZO-1 staining with increasing APAP dose. ZO-1 staining becomes intermittent at 75 mg/kg, and virtually non-existent at 300 mg/kg. The bar chart in (c) displays the results of the IHC detection algorithm, which parallel those of the images in a and b; Inset: section of mouse liver showing typical APAP-induced centrilobular necrosis, at intermediate (150 mg/kg) and high (300 mg/kg) APAP dose, but not at low dose (75 mg/kg). IHC, DAB Haematoxylin, scale bar = 50 μm.

