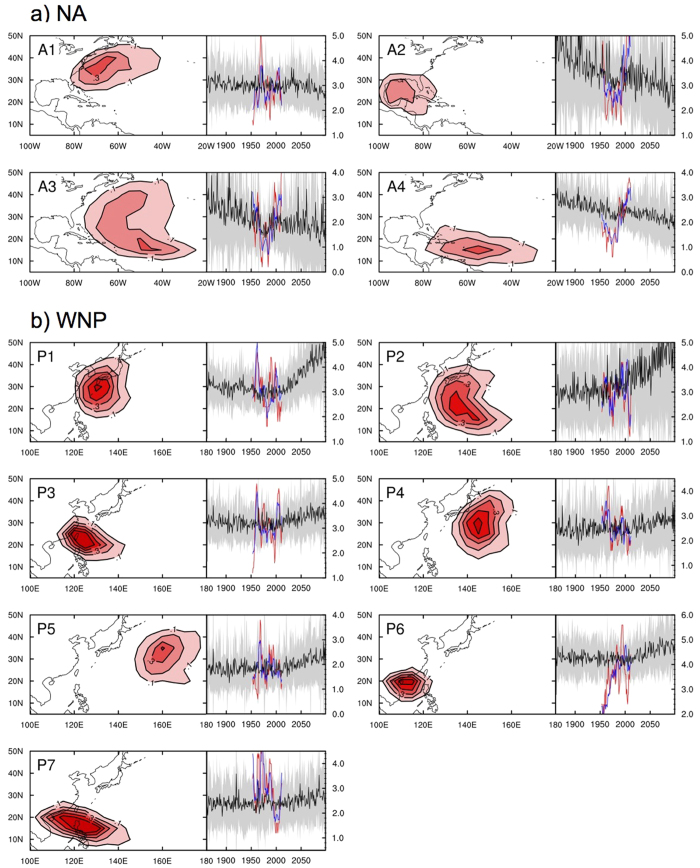
Figure 2. Four and seven clusters of NA and WNP TC tracks (contour interval is 0.1 ratio), their associated time series of observations (red lines), NCEP/NCAR-based retrospective forecast for the period from 1951–2013 (blue lines), and CMIP5-based forecast for the period from 1861–2099 (black lines and gray shading), respectively.
For the CMIP5-based forecast, black lines and gray shading indicate the ensemble mean and one-standard-deviation ranges, respectively. The figure was plotted by using NCL version 6.3.0, “The NCAR Command Language (Version 6.3.0) [Software]. (2016). Boulder, Colorado: UCAR/NCAR/CISL/TDD. http://dx.doi.org/10.5065/D6WD3XH5”.

