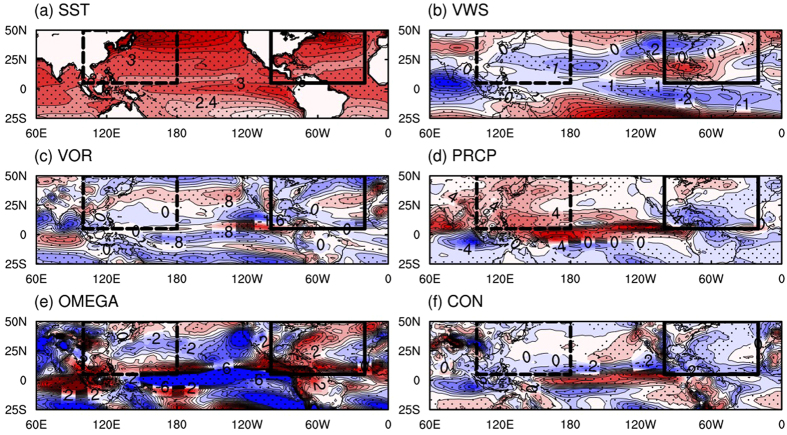
Figure 5.
Differences in (a) spatial patterns of SST (contour interval is 0.3 °C), (b) vertical wind shear between 850- and 200 hPa (VWS, contour interval is 0.5 m s−1), (c) 1000–700 hPa relative vorticity (VOR, contour interval is 0.4 × 10⁻⁶ s−1), (d) convective precipitation (PRCP, contour interval is 2.0 × 10⁻¹ mm day−1) (e) 500-hPa omega (OMEGA, contour interval is 1 × 10⁻³ Pa s−1), and (f) 1000–700 hPa convergence (CON, contour interval is 0.5 × 10⁻⁶ s−1) between the late 21st century (2080–2099) and the present climate period (1986–2005). Red and blue colors indicate positive and negative values, respectively. Dots indicate 15 of 22 CMIP5 models showing the same signs of averages in differences of TC occurrence frequency. Black boxes with dashed and solid lines indicate WNP and NA ocean basins, respectively. The figure was plotted by using NCL version 6.3.0, “The NCAR Command Language (Version 6.3.0) [Software]. (2016). Boulder, Colorado: UCAR/NCAR/CISL/TDD. http://dx.doi.org/10.5065/D6WD3XH5”.

