
Figure 1. Example pupil trace and baseline-corrected average.
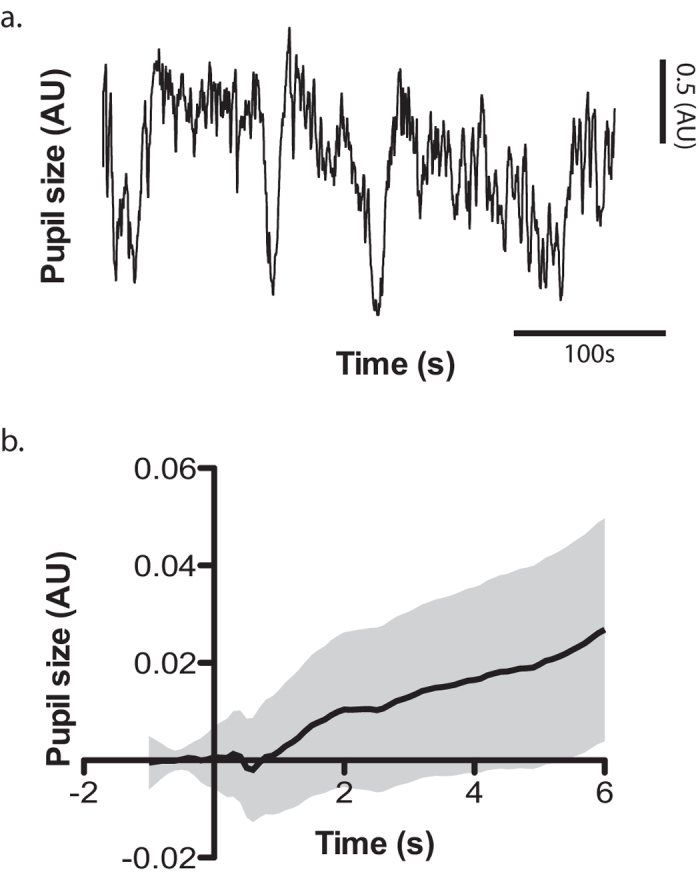
(a) Pupil trace of one example block illustrating the high-level of low-frequency noise in the data. (b) Baseline-corrected average of one example block. The actual pupil response to the image presentation is masked by the large upward slope, which failed to be suppressed by baseline subtraction. The shaded gray area illustrates the 95% confidence interval.