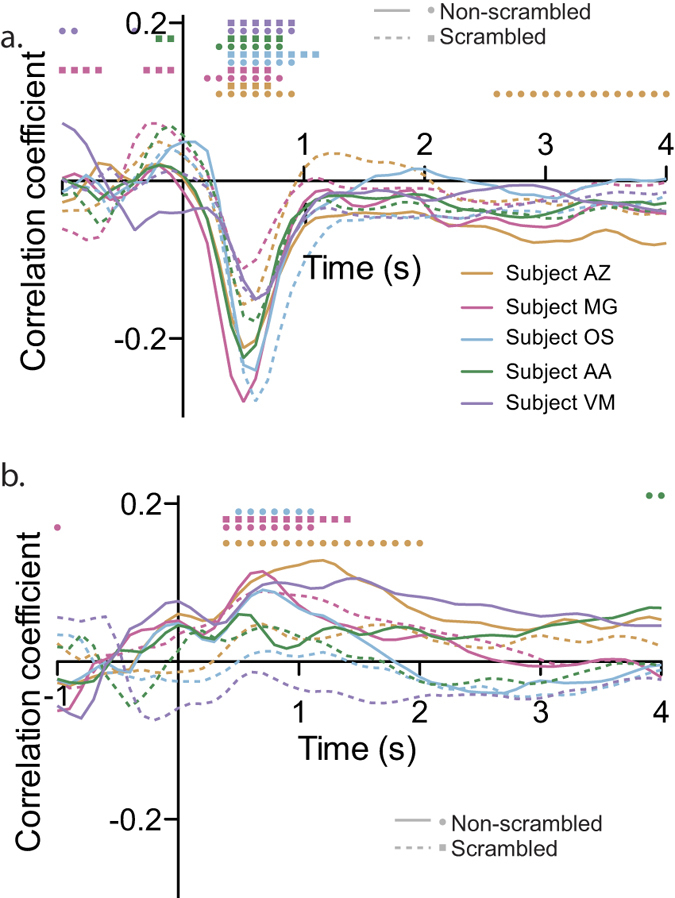
Figure 2.

Correlation between the Lab luminance (a) and arousal score (b) of the affective pictures and the baseline-corrected pupil response as a function of time. Subjects are color-coded, while non-scrambled and scrambled blocks are represented with the solid and dashed lines, respectively. Dots (square for non-scrambled and circles for scrambled blocks) on the top of each panel mark the bins in which the correlation was significant (alpha = 0.05).
