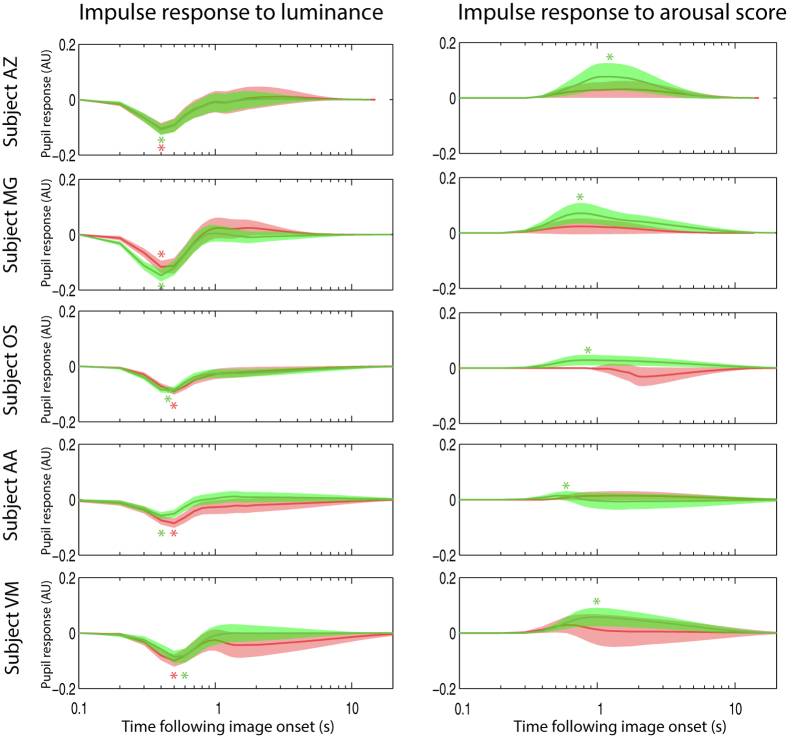
Figure 5. Impulse responses to Lab luminance and arousal scores in all participants.
Shaded areas indicate the 99% confidence interval. Green curves correspond to non-scrambled blocks, while red curves correspond to data from the scrambled blocks. Asterisks indicate peak values within the significant bins.

