
Figure 7. Difference between innovation error distributions (estimated from the Kolmogorov-Smirnov statistic shown on the y-axes) across sub-blocks, as a function of the time interval between sub-blocks.
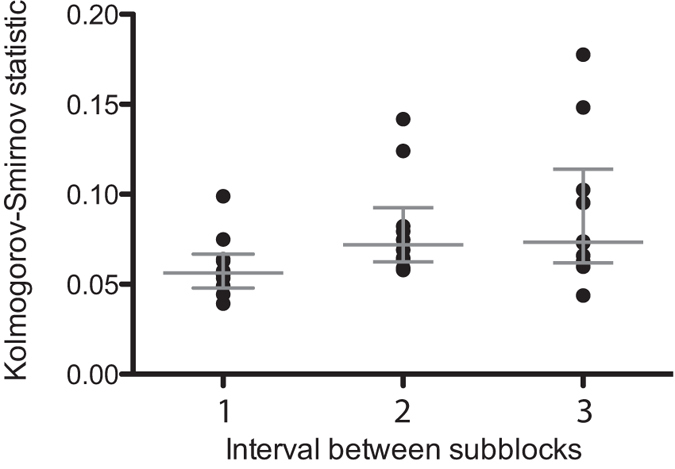
Each circle corresponds to one experimental block (either scrambled or non scrambled) from one subject. Gray lines indicate median and interquartile range.