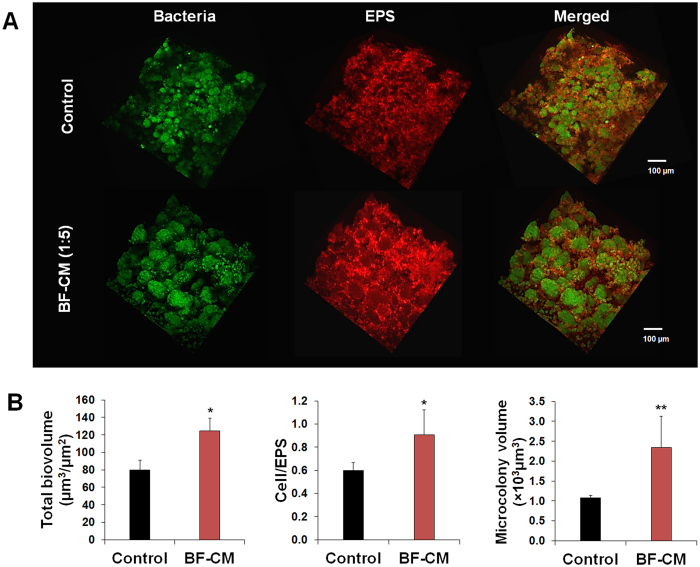
Figure 2. Three-dimensional (3D) architecture and quantitative computational analysis of biofilm formed in BF-CM.
(A) Representative confocal images of S. mutans biofilms grown in BF-CM (1:5vol/vol, CM:UFTYE) and without supplementation (control). The bacterial microcolonies are depicted in green (SYTO 9), while the EPS-matrix is depicted in red (Alexa Fluor 647). (B) Quantitative analysis of total biovolume (biomass), cell/EPS ratio and microcolony volume (size) was performed using COMSTAT. Data represent mean ± SD (n = 8). A pairwise comparison between control and BF-CM was conducted using student’s t-test. Values are significantly different from each other at *P < 0.05 or **P < 0.01.

