Fig. 2.
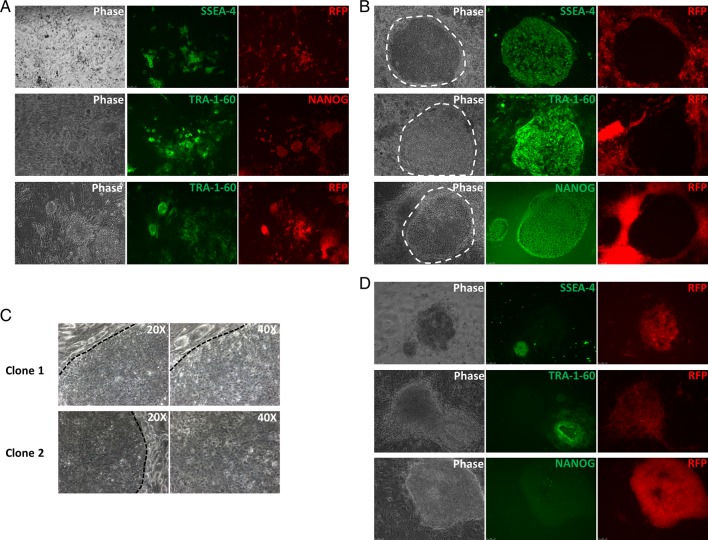
Analysis of morphology, pluripotency marker expression and transgene silencing in the colonies emerging during reprogramming. (A) Expression of SSEA-4 and RV-RFP (upper panel), TRA-1-60 and NANOG (middle panel) and TRA-1-60 and RV-RFP (lower panel) in the cell clusters/colonies on day 9 of reprogramming showing the initiation of pluripotency marker expression before the cells achieve hESC-like morphology and transgene silencing. (B) Expression of the pluripotency markers (SSEA-4, TRA-1-60 and NANOG) and RV-RFP silencing in the colonies on day 16 of reprogramming. The emerging hiPSC colonies showed characteristic hESC-like morphology and retroviral transgene silencing allowing their easy identification. (C) Higher magnification images of RV-RFP− hiPSC colonies showing their hESC-like morphology – flat appearance, defined boundary and high nuclear-to-cytoplasmic ratio. (D) Non-hESC like RFP+ colonies which lacked the expression of pluripotency markers on day 16. All images are at 10× magnification, unless otherwise indicated. The broken lines show the characteristic boundaries of the emerging hiPSC colonies on the feeder cells.

