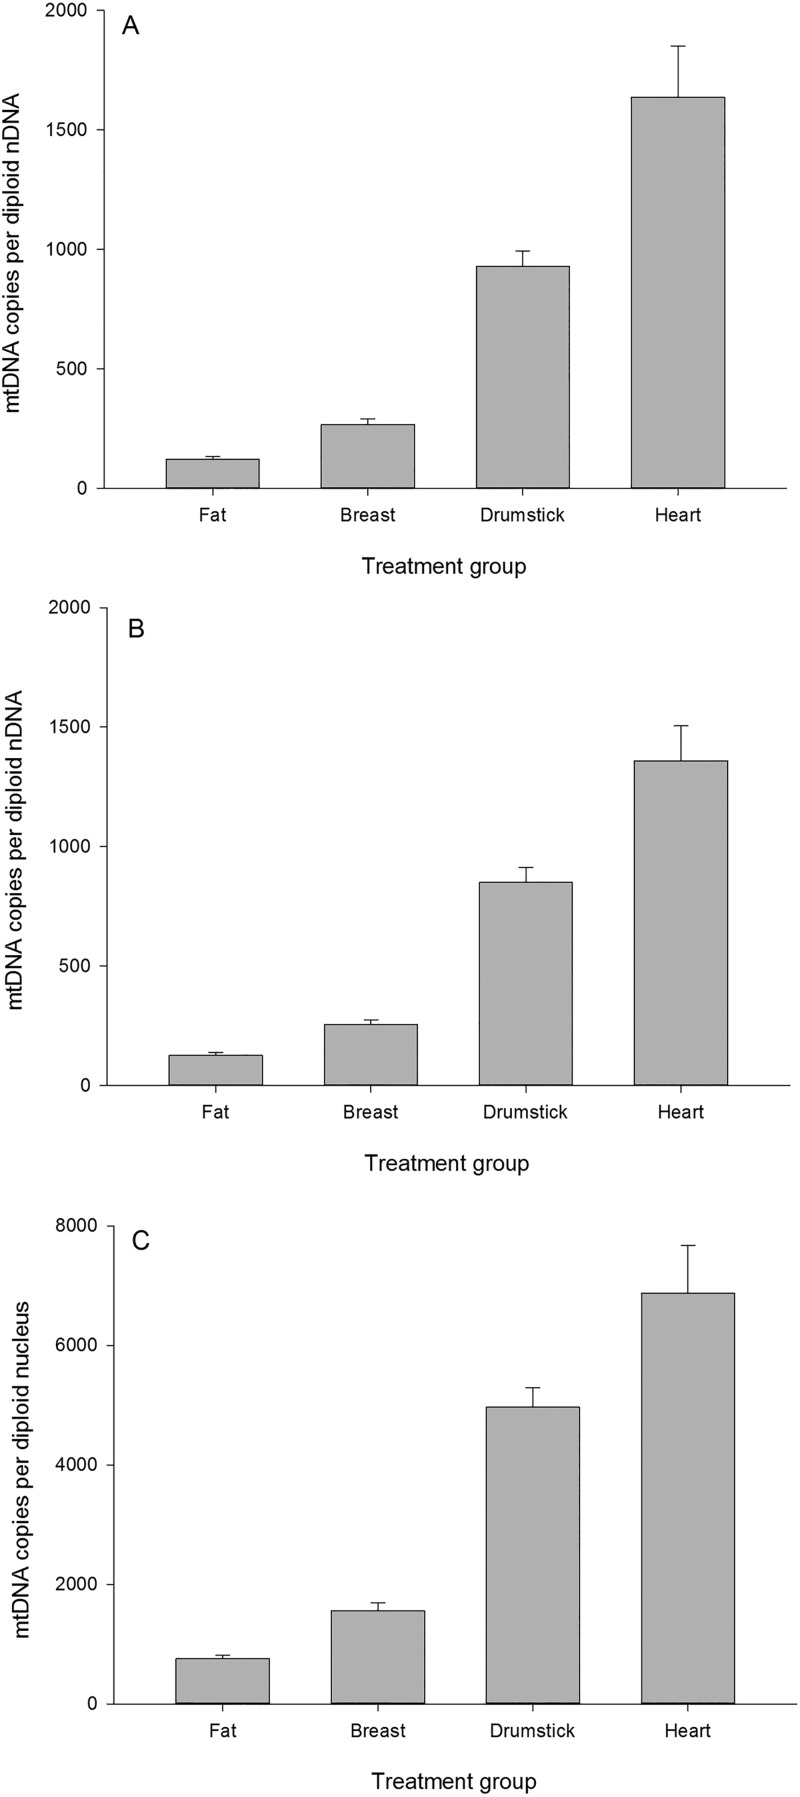
Fig. 3.
Estimation of mitochondrial content across four chicken tissues using the Taqman assay. The same samples were assayed independently on two independent runs (panel A and B). In panel C differential PCR efficiency has been accounted for using the same raw data as shown in panel A. Data shown as means±s.d.

