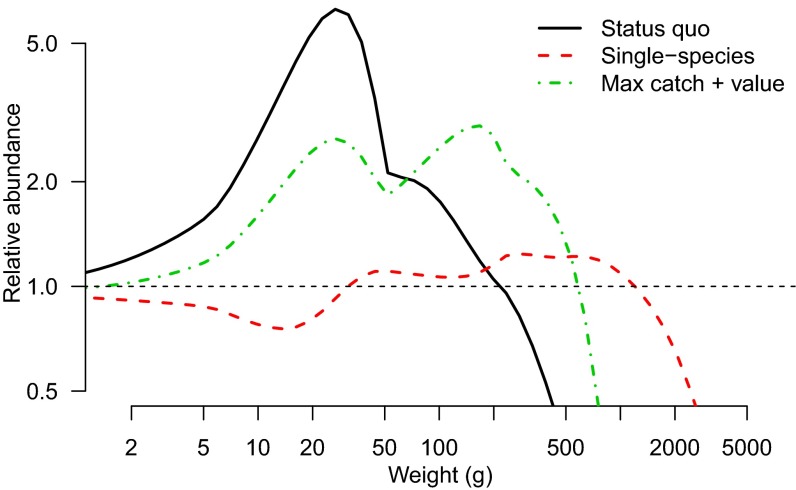
Fig. 2.
Trophic cascades resulting from different management strategies implemented in the size-spectrum model of the East China Sea. Changes in abundance are relative to unfished levels, indicated by the dotted black line at a relative abundance of “1”; x axis is the weight in grams of fish within the model.

