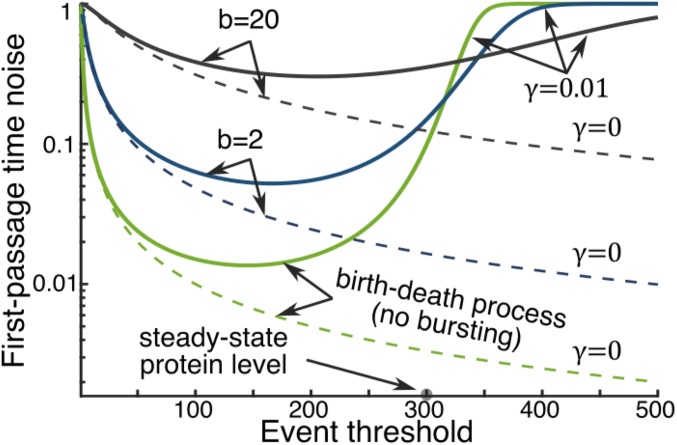
Fig. 2.
Relative positions of the event threshold and the steady-state protein level determine noise in timing. Noise in the FPT () is plotted as a function of the event threshold () for different mean protein burst sizes and decay rates . For , the noise is high at small values of and decreases with increasing , which is similar to the versus trend when (dashed lines). After attaining a minima at an intermediate value of , increases with further increase in . The minimum value of is achieved at for a birth–death process, and this optimal point shifts to the right as is increased while keeping fixed by commensurate change in . The steady-state protein level and the decay rate are taken as molecules, and per min.

