Fig. 1.
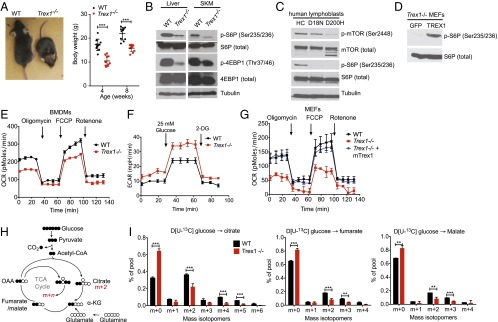
Reduced mTORC1 activity and defective mitochondrial respiration in Trex1−/− cells and tissues. (A) Representative images of WT and Trex1−/− mice at the age of 6–8 wk. Body weight was measured at 8 wk (n = 10). (B) Immunoblot analysis of phosphorylated and total S6P and 4E-BP1 in WT and Trex1−/− mouse tissues. (C) Immunoblot analysis of phosphorylated and total mTOR and S6P in healthy control (HC) and TREX1-D18N and TREX1-D200H mutant patient lymphoblasts. (D) Immunoblot analysis of phosphorylated and total S6P in Trex1−/− MEFs reconstituted with GFP (control) or mouse TREX1. (E–G) Real-time changes in the OCR and ECAR of WT or Trex1−/− BMDMs (E and F) or MEFs (G). OCR was assessed during subsequent sequential treatment with oligomycin (inhibitor of ATP synthase), FCCP (carbonyl cyanide 4-(trifluoromethoxy) phenylhydrazone), and rotenone (inhibitors of the electron-transport chain). ECAR was assessed during sequential treatment with 25 mM glucose and 2-deoxyglucose (2-DG). (H) Schematic representation of metabolism of [U-13C]glucose for experiments in G. (I) Mass isotopomer analysis of citrate, fumarate, and malate in cells cultured with [U-13C]glucose and unlabeled glutamine. Data are presented as the means ± SEM of quadruplets of two to three independent experiments. *P < 0.05; **P < 0.01; ***P < 0.001 (Student’s t test).

