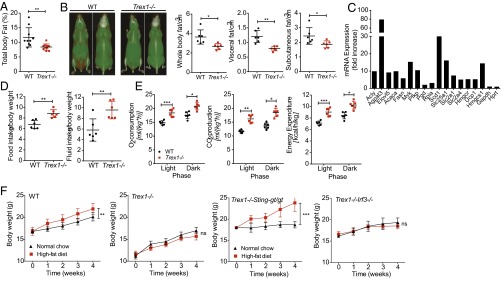
Fig. 4.
Trex1−/− mice exhibit a hypermetabolic state with reduced adiposity and increased energy expenditure. (A) Percentage of total body fat in WT and Trex1−/− mice (n = 10). (B) High-resolution micro-CT scan images of WT and Trex1−/− mice (front and back view of the same mouse, red indicates fat mass). Representative images are shown on the left. Quantitation of whole-body, visceral, and subcutaneous fat volume is shown on the right (n = 6). (C) qRT-PCR analysis of selected genes involved in lipid metabolic pathways. (D) Food and fluid intake in WT and Trex1−/− mice over a period of 5 d (n = 6). (E) Oxygen consumption, CO2 production, and energy expenditure in WT and Trex1−/− mice (n = 6). (F) Body weights of WT or Trex1−/−, Trex1−/−Stinggt/gt, and Trex1−/−Irf3−/− mice on normal chow or HFD over a period of 4 wk (n = 9). Data are presented as the means ± SEM *P < 0.05; **P < 0.01; ***P < 0.001 (Student’s t test).

