Fig. 2.
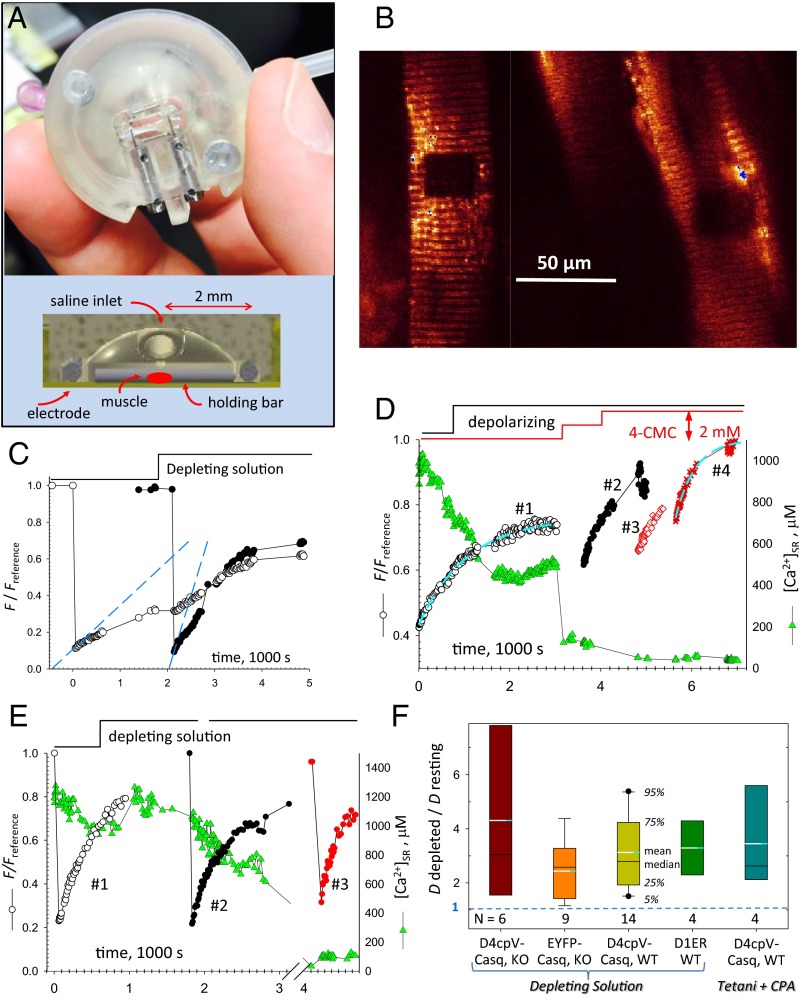
FRAP properties of tagged Casq1 (also Figs. S3 and S4 and SI Appendix). (A) Experimental chamber with FDB bundle in place (Top) and cutoff view of the 3D printed file (Bottom). (B) Confocal image of fluorescence of FDB bundle expressing EYFP-Casq1, showing two regions bleached before (Right) and after (Left) perfusion with solution 2. (C) Normalized fluorescence in the two bleached regions. Note the change in (slope of dashed lines) in depleting solution. (D) FRAP of D4cpV-Casq1. As illustrated by the green symbols, [Ca2+]SR measured by the biosensor. Other symbols plot in regions bleached successively as increasingly depleting solutions were applied. The red steps at the top indicate successive applications of 1 and 2 mM 4-CMC. The dashed cyan curves represent exponential fits used to determine the immobile fraction of fluorescence (Methods). The rates were 0.8, 2.1, 1.35, and 3.1 (1,000 s)−1, respectively, in regions 1–4. (E) FRAP of biosensor D1ER. The rates were 1.25, 1.59, and 2.53 (1.000 s)−1 in regions 1–3. (F) Summary of depletion effects, expressed as Ddepleted/Dresting, equal to . N, numbers of region pairs, usually located on the same cell, for each condition. Quantifiers are keyed by the central box. The calculation of levels 5% and 95% (represented by the bars) requires n ≥ 9, and was therefore not possible in all cases.

