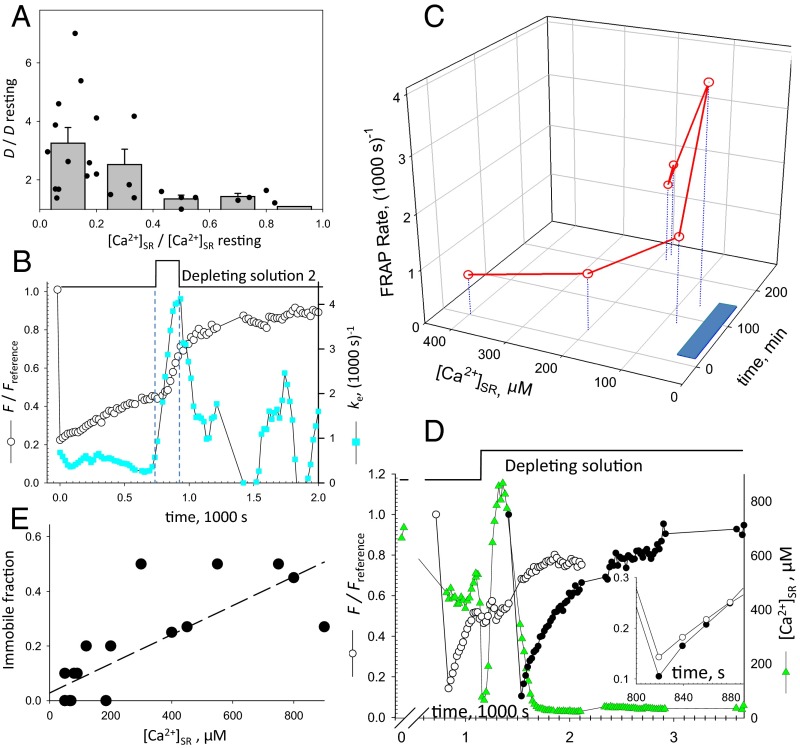
Fig. 3.
FRAP indicators of reversible protein depolymerization (also Figs. S3C and S5). (A) Increase in FRAP rate of D4cpV-Casq1 () vs. reduction in [Ca2+]SR for individual experiments (symbols) and averages over 0.2-wide bins in abscissa. (B) Reversibility of the effect of exposure to solution 2. Circles represent the evolution of of EYFP-Casq1 in a bleached region. Note the change in the slope of recovery after solution change. Squares represent the normalized recovery rate , showing reversion of effect on washout. (C) Initial rate of D4cpV-Casq1 in six successively bleached regions, and simultaneously measured [Ca2+]SR. The blue bar on time axis marks the application of depleting solution 0. The rate increases as [Ca2+]SR slowly decreases, and recovers on washout. The large increase in lags behind the decay in [Ca2+]SR. (D) Green symbols show that [Ca2+]SR undergoes a large oscillation upon exposure to solution 5 (additional examples are provided in Fig. S5). went from 0.85 in a cell at rest (open circles) to 1.8 upon depletion (filled circles. (Inset) Details of initial recovery. (E) Relationship between [Ca2+]SR and the immobile fraction of fluorescence, defined as , where is the limit value of at long times. The linear correlation coefficient ρ2 is 0.61.

