Fig. 4.
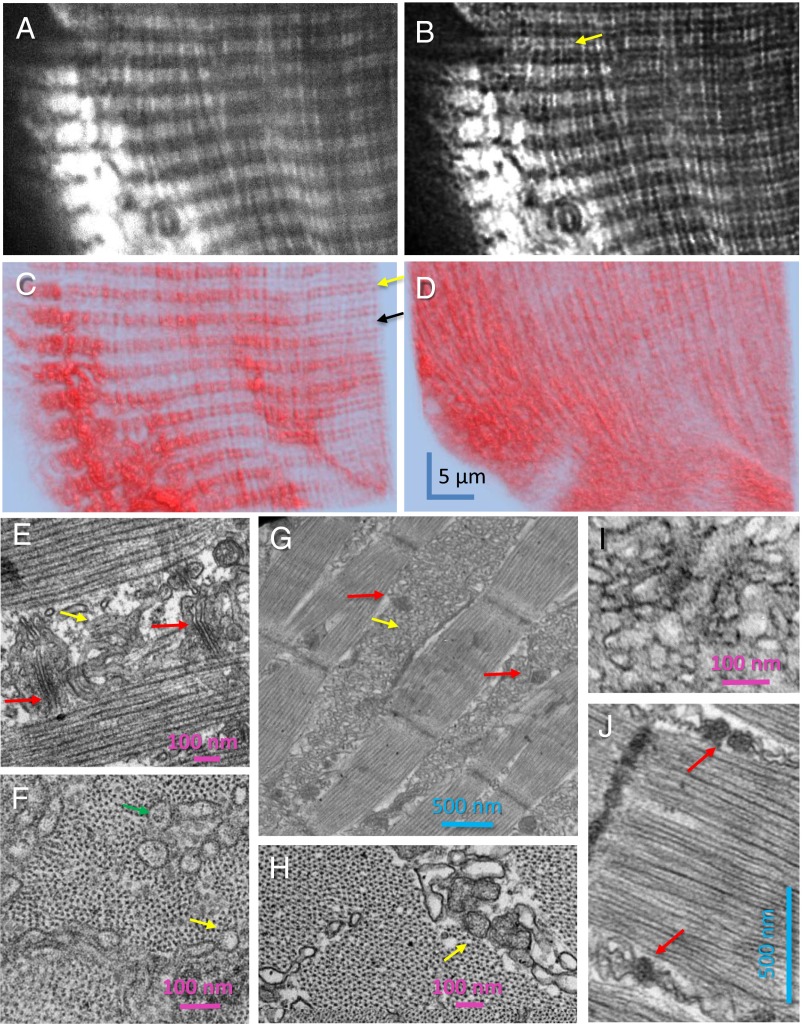
Consequences of depletion on SR structure (also Figs. S7 and S8). (A–D) D4cpV-Casq1 images with a high numerical aperture oil immersion objective. One image of a 30-image z-stack, raw (A) and deblurred (B), showing the double-band location of Casq1. (C) Three-dimensional rendering of the deblurred stack by the simulated fluorescence process algorithm. The yellow arrow indicates the location of the Z disk at the center of the double band (24). The black arrow marks the center of the A band. (D) Three-dimensional rendering of a z-stack acquired on same myofiber after 20 min in solution 5. (E) Representative EM image of a longitudinal section of a resting myofiber, showing triads (red arrows) constituted by two TC with dense granular content and a transverse tubule, and longitudinal SR cisternae, which usually appear empty (yellow arrow) or with finely granular content. (F) Transversal section of resting fiber near the Z disk showing sectioned longitudinal SR elements, which may be empty (yellow arrow) or may show granular content (green arrow) suggesting an extratriadic location of Casq1. (G and H) Sections from the muscle in A–D imaged after depletion. Large aggregations of membrane in intermyofibrillar spaces, corresponding to the longitudinal structures formed by fluorescent Casq1 in D, are shown in G and I. The cross-section in H, comparable to F, includes interfibrillar elements with calsequestrin-like content (arrow). (I and J) High-magnification views in a second muscle, equally treated. The details of altered triads in J (red arrows), visible also in G, allow identification of the intricate membrane structures as SR. Additional details are provided in Fig. S8.

