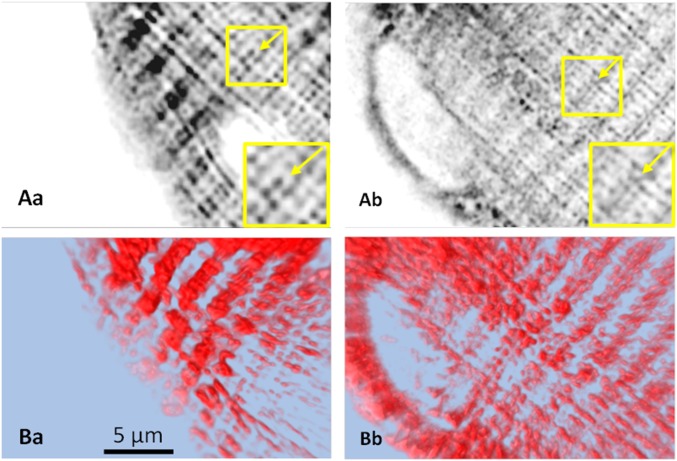
Fig. 6.
Structural effects of fatiguing stimulation. (A) Deblurred high-resolution images of D4cpV-Casq1 in z-stacks of the same cell at rest (a) and after 20 min of application of stimulation pattern 2 in Tyrode with 0.5 mM CPA (b). (Inset) Arrows in A in the boxed region magnified indicate location of the Z disk relative to the double-band pattern of tagged Casq1 expression. After stimulation, this region is occupied by a band of fluorescence. (B, a and b) Three-dimensional rendering of same stacks.

