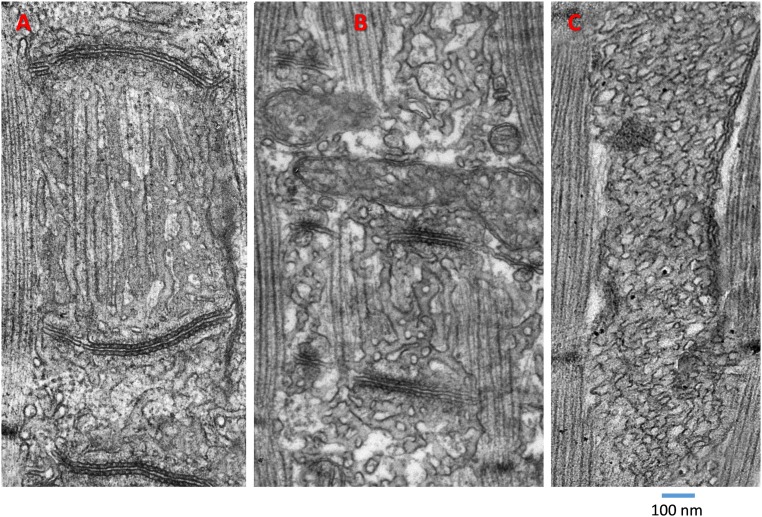
Fig. S8.
Example images used to quantify SR membrane area density (supports Figs. 4–6). (A) Image from control muscle. (B) Muscle treated with solution 1 (causing mild depletion). (C) Muscle treated with solution 5 (full depletion). The length of every continuous SR membrane intersection visible in regions like those regions pictured was measured, and the sum was normalized to the area of the image. Ratios obtained in this way in five regions in five sections from the same or comparably treated muscles were averaged. The results were 23.5 (μm)−1 (SEM = 2.21) in control images and 20.1 (μm)−1 (SEM = 3.97) in fully depleted cells (the comparison was not extended to mildly depleted cells). The difference is not significant.

