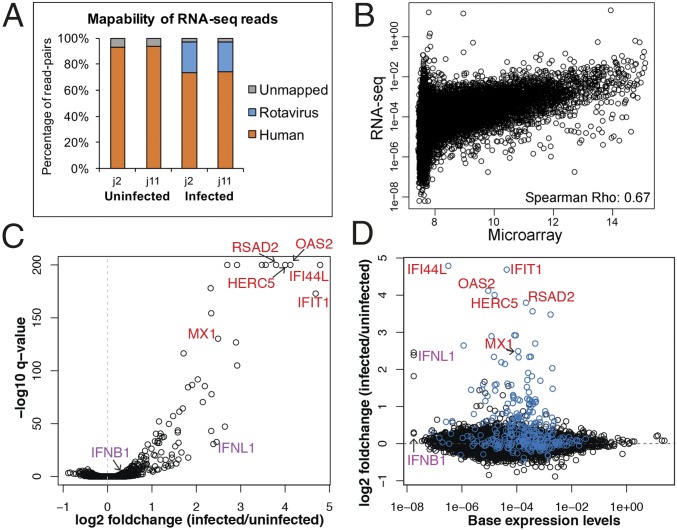
Fig. 2.
Transcriptional response to HRV infection assessed by RNA-seq. HIEs from two individuals (j2 and j11) were mock- or HRV-inoculated (MOI of 20). At 6 hpi, total RNA was extracted and RNA-seq was performed on rRNA-reduced samples. (A) Bar plot depicts relative abundance of reads mapped to the human and rotavirus genomes. (B) Scatter plot depicts mean baseline expression estimates (mock-inoculated samples, 6 hpi) of transcripts from the microarray (x-axis) and RNA-seq (y axis) experiments. (C) Volcano plot depicts the results of the differential gene expression analysis. The x and y axes correspond to the log2 fold change and −log10 q-value (FDR), respectively. (D) Scatter plot depicts basal expression levels in mock-inoculated samples (x-axis) and the log2 fold change (y axis) with infection. ISGs are colored in blue. Gene symbols in C and D indicate specific ISGs (red) or IFNs (purple).

